


These docs are for Cribl Stream 4.6 and are no longer actively maintained.
See the latest version (4.17).
Destinations
Cribl Stream can send transformed data to various Destinations, including Cribl HTTP, Cribl TCP, Cribl Lake, Elasticsearch, Amazon Kinesis, Amazon S3 and other object stores, Prometheus and compatible services, InfluxDB, Splunk, Snowflake, Databricks, TCP JSON, and many others.
Destinations can write data to either IPv4 or IPv6 addresses.

Destinations Summary
Cribl Stream supports the following Destinations. Streaming Destinations accept events in real time. All HTTP-based Destinations are proxyable.
| Destination | Protocol | Streaming | Filesystem-based | Load-balanced |
|---|---|---|---|---|
| Amazon S3 Compatible Stores | HTTP/S | Non-streaming | ✓ | |
| Amazon CloudWatch Logs | HTTP/S | Streaming | ||
| Data Lakes > Cribl Lake | HTTP/S | Non-Streaming | ||
| Data Lakes > Amazon S3 | HTTPS only | Non-Streaming | ✓ | |
| Data Lakes > Amazon Security Lake | HTTP/S | Non-Streaming | ✓ | |
| Amazon Kinesis Streams | HTTP/S | Streaming | ||
| Amazon MSK | TCP | Streaming | ||
| Amazon SQS | HTTP/S | Streaming | ||
| Azure Blob Storage | HTTPS only | Batching | ✓ | |
| Azure Data Explorer | HTTPS only | Streaming or non-streaming | ||
| Azure Event Hubs | TCP | Streaming | ||
| Azure Monitor Logs | HTTPS only | Streaming | ||
| Azure Sentinel | HTTP/S | Streaming | ||
| Confluent Cloud | TCP | Streaming | ||
| CrowdStrike Falcon LogScale | HTTPS only | Streaming | ||
| Datadog | HTTPS only | Streaming | ||
| Elasticsearch | HTTP/S | Streaming | ✓ | |
| Elastic Cloud | HTTPS only | Streaming | ✓ | |
| Exabeam | HTTP/S | Non-Streaming | ✓ | |
| Filesystem/NFS | Non-Streaming | ✓ | ||
| Google Chronicle | HTTPS only | Streaming | ||
| Google Cloud Logging | HTTPS only | Streaming | ||
| Google Cloud Pub/Sub | HTTPS only | Streaming | ||
| Google Cloud Storage | HTTPS only | Non-Streaming | ✓ | |
| Grafana Cloud | HTTP/S | Streaming | ||
| Graphite | TCP or UDP | Streaming | ||
| Honeycomb | HTTPS only | Streaming | ||
| InfluxDB | HTTP/S | Streaming | ||
| Kafka | TCP | Streaming | ||
| Loki | HTTP/S | Streaming | ||
| MinIO | HTTP/S | Non-Streaming | ✓ | |
| New Relic Events | HTTPS only | Streaming | ||
| New Relic Logs & Metrics | HTTPS only | Streaming | ||
| OpenTelemetry (OTel) | gRPC over HTTP/S or TCP | Streaming | ||
| Prometheus | HTTP/S | Streaming | ||
| SentinelOne DataSet | HTTPS only | Streaming | ||
| SignalFx | HTTPS only | Streaming | ||
| SNMP Trap | UDP | Streaming | ||
| Splunk HEC | HTTP/S | Streaming | ✓ | |
| Splunk Load Balanced | TCP | Streaming | ✓ | |
| Splunk Single Instance | TCP | Streaming | ||
| StatsD | TCP or UDP | Streaming | ||
| StatsD Extended | TCP or UDP | Streaming | ||
| Sumo Logic | HTTP/S | Streaming | ||
| Syslog | TCP or UDP | Streaming | ✓ (TCP only) | |
| TCP JSON | TCP | Streaming | ✓ | |
| Wavefront | HTTPS only | Streaming | ||
| Webhook | HTTP/S | Streaming |
The Amazon S3 Compatible Stores Destination can be adapted to send data to downstream services like Databricks and Snowflake, for which Cribl Stream currently has no preconfigured Destination. For details, please contact Cribl Support.
Internal and Special-Purpose Destinations
These special-purpose Destinations route data within your Cribl Stream deployment, or among Workers across distributed or hybrid Cribl.Cloud deployments:
- Default: Specify a default output from among your configured Destinations.
- Output Router: A “meta-Destination.” Configure rules that route data to multiple configured Destinations.
- DevNull: Simply drops events. Preconfigured and active when you install Cribl Stream, so it requires no configuration. Useful for testing.
- Cribl HTTP: Send data among peer Worker Nodes over HTTP. Streaming and load-balanced.
- Cribl TCP: Send data among peer Worker Nodes over TCP. Streaming and load-balanced.
- Cribl Stream (Deprecated): Use either Cribl HTTP or Cribl TCP instead.
- SpaceOut: This experimental Destination is undocumented. Be careful!
How Does Non-Streaming Delivery Work
Cribl Stream uses a staging directory in the local filesystem to format and write outputted events before sending them to configured Destinations. After a set of conditions is met - typically file size and number of files, further details below - data is compressed and then moved to the final Destination.
An inventory of open, or in-progress, files is kept in the staging directory’s root, to avoid having to walk that directory at startup. This can get expensive if staging is also the final directory. At startup, Cribl Stream will check for any leftover files in progress from prior sessions, and will ensure that they’re moved to their final Destination. The process of moving to the final Destination is delayed after startup (default delay: 30 seconds). Processing of these files is paced at one file per service period (which defaults to 1 second).
In Cribl.Cloud, using a staging directory is only available on hybrid, customer-managed Workers.
Batching Conditions
Several conditions govern when files are closed and rolled out:
File reaches its configured maximum size.
File reaches its configured maximum open time.
File reaches its configured maximum idle time.
If a new file needs to be open, Cribl Stream will enforce the maximum number of open files, by closing files in the order in which they were opened.
Data Delivery and Persistent Queues
Cribl Stream attempts to deliver data to all Destinations on an at-least-once basis. When a Destination is unreachable, there are three possible behaviors:
- Block - Cribl Stream will block incoming events.
- Drop - Cribl Stream will drop events addressed to that Destination.
- Queue - To prevent data loss, Cribl Stream will write events to a Persistent Queue disk buffer, then forward them when a Destination becomes available. (Available on several streaming Destinations.)
For further information about backpressure, see Destination Backpressure Triggers.
You can configure your desired behavior through a Destination’s Backpressure Behavior drop-down. Where other options are not displayed, Cribl Stream’s default behavior is Block. For details about all the above behaviors and options, see Persistent Queues.
Configuring Destinations
For each Destination type, you can create multiple definitions, depending on your requirements.
To configure Destinations, in single-instance deployments, select Manage, then proceed to the options below. In distributed deployments, first click Manage, then select a Worker Group to configure and choose one of the options below.
- To access the graphical QuickConnect UI, click Destinations. Next, select the desired type, and then click either Add New or (if displayed) Select Existing.
- To access the Routing UI, click Data > Destinations. On the resulting Manage Destinations page’s tiles, select the desired type, then click Add New.
To edit any Destination’s definition in a JSON text editor, click Manage as JSON at the bottom of the New Destination modal, or on the Configure tab when editing an existing Destination. You can directly edit multiple values, and you can use the Import and Export buttons to copy and modify existing Destination configurations as .json files.
When JSON configuration contains sensitive information, it is redacted during export.
Capturing Outgoing Data
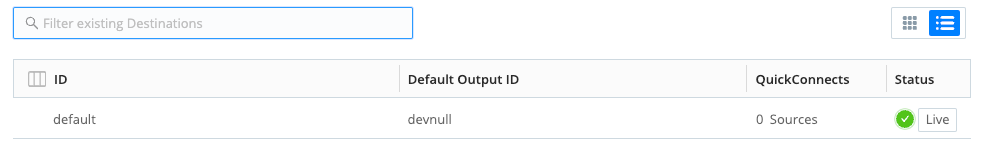
To capture data from a single enabled Destination, you can bypass the Preview pane, and instead capture directly from a Manage Destinations page. Just click the Live button beside the Destination you want to capture.
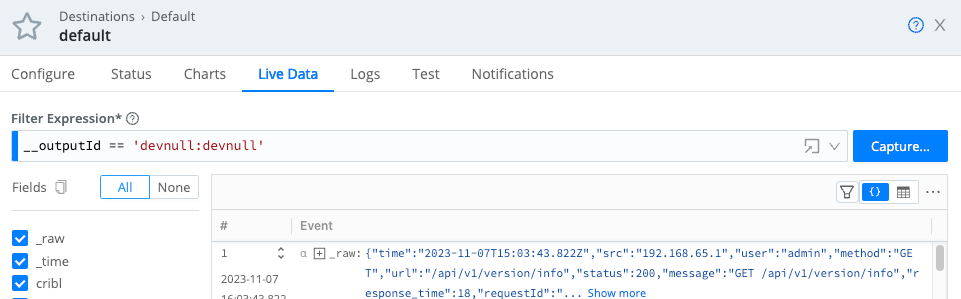
You can also start an immediate capture from within an enabled Destination’s config modal, by clicking the modal’s Live Data tab.
Monitoring Destination Status
Each Destinations’s configuration modal offers two tabs for monitoring: Status and Charts.
Status Tab
The Status tab provides details about the Workers in the group and their status. An icon shows whether the Worker is operating normally.
You can click each Worker’s row to see specific information, for example, to identify issues when the Destination displays an error. The specific set of information provided depends on the Destination type. The data represents only process 0 for each Worker Node.
The content of the Status tab is loaded live when you open it and only displayed when all the data is ready. With a lot of busy Workers in a group, or Workers located far from the Leader, there may be a delay before you see any information.
The statistics presented are reset when the Worker restarts.
Charts Tab
The Charts tab presents a visualization of the recent activity on the Destination. The following data is available:
- Events in
- Thruput in (events per second)
- Bytes in
- Thruput in (bytes per second)
- Blocked status
This data (in contrast with the status tab) is read almost instantly and does not reset when restarting a Worker.