


These docs are for Cribl Stream 4.9 and are no longer actively maintained.
See the latest version (4.17).
Get Started with Cribl Stream
Welcome to Cribl Stream! This tutorial is a hands-on guide to the core features and common use cases of Cribl Stream. You will set up a basic deployment using mock data from a mobile phone company, giving you a real-world example of how Cribl Stream helps you work with and transform data efficiently.
In this tutorial, you will learn how to:
- Add a Source, Destination, Pipeline, and Route to get data flowing in and out of Cribl Stream.
- Capture and filter sample data.
- Use Functions to:
- Mask sensitive data.
- Parse raw data, promoting it to key-value fields.
- Add, remove, or rename data fields.
- Drop unnecessary data events.
This tutorial takes approximately 1 hour to complete. However, you don’t need to finish it in one sitting. Your progress will persist in Cribl Stream between sessions.
Before You Start: Set Up a Cribl.Cloud Organization
The easiest way to complete this tutorial is on a Cribl.Cloud Organization, which is fully managed on your behalf by Cribl and includes Cribl Stream. If you already have one set up, you can use that Organization. Otherwise, to set up a free Cribl.Cloud Organization and register it in the Cribl.Cloud portal. See Register a Cribl.Cloud Portal for additional information.
If you prefer to download Cribl Stream software and deploy it on infrastructure that you manage, see Installing on Linux.
Step 1: Add a Source to Get Data into Cribl Stream
In this step, you will begin working with the basic building blocks of Cribl Stream to get data flowing in to your deployment. You will add a Source to your Cribl Stream deployment and verify data is coming into Cribl Stream by viewing the Monitoring page. See Cribl Stream Basic Concepts for more information about Sources and other useful concepts.
A Source receives data from an upstream sender. Cribl Stream can receive data from a variety of senders, such as syslog (UDP/TCP), Splunk, and Amazon S3. For this tutorial, you will enable a Cribl Stream built-in datagen (data generator) that generates a stream of realistic sample log data from a mock mobile phone company.
To add a Source:
On the top bar, select Products. Under Stream, select Worker Groups. Then, select a Worker Group. If you’re working with a new deployment of Cribl Stream, you will only see one Worker Group named
default. Select that Worker Group or another Worker Group.A Worker Node is a Cribl Stream instance that is managed by a Leader Node. Worker Nodes are responsible for processing data and handling networking for a cluster. A Worker Group is a collection of Worker Nodes that share the same configuration. See Distributed Deployment for more information.
On the Worker Groups submenu, select Data > Sources.
From the Data Sources page’s tiles or left menu, select Datagen. Select Add Source to configure a new datagen source.
You can use the search box to jump to the Datagen tile.
In the Input ID field, name this Source
businessevent.In the Description field, enter
Log events for a sample business scenario.In the Data Generator File menu, select
businessevent.log.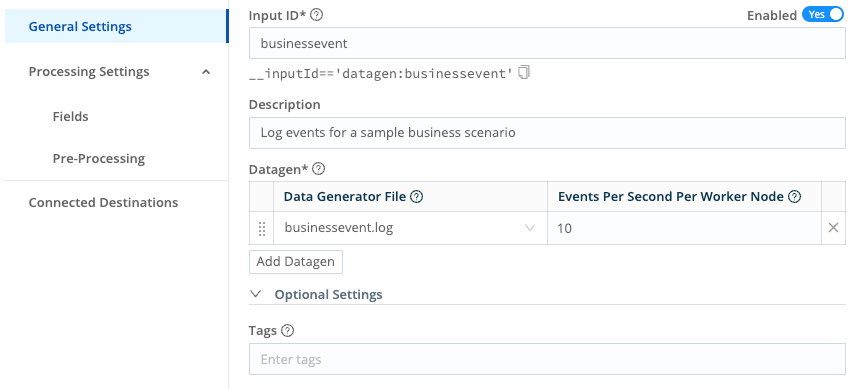
Configure a datagen Source Save your changes. In the Global Commit menu, select Commit. Write a commit message, such as
Add datagen Source. Then, select Commit & Deploy to deploy the changes to your Worker Group.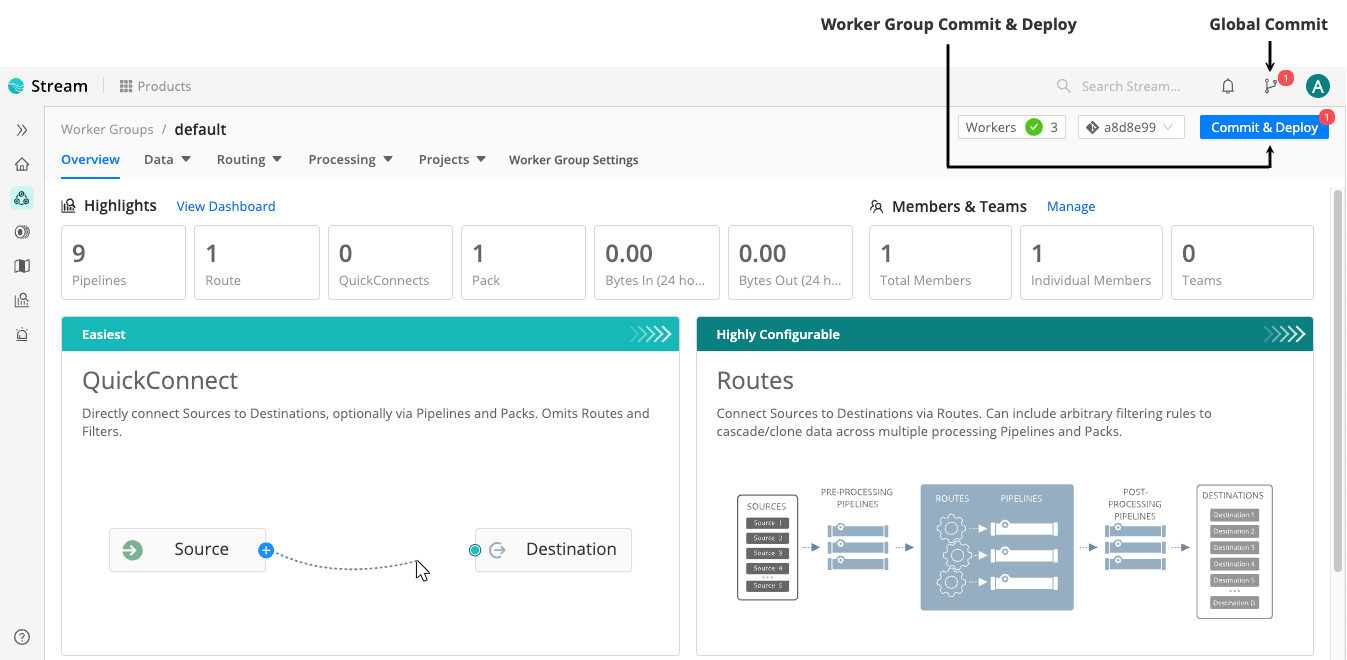
Commit and Deploy controls in the user interface Verify that the datagen Source is ready to generate sample data by confirming that the Enabled column next to the
businesseventtoggle is set toYes.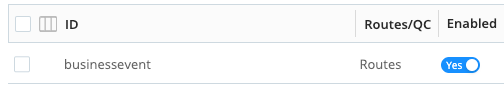
Verify datagen Source
Now that sample data is flowing into your Cribl Stream deployment, you will learn how to add a Destination to receive the data in the next step.
Step 2: Add a Destination to Send Data to a Receiver
In this step, you will add a Destination to your Cribl Stream deployment and verify data is coming in and out of Cribl Stream by viewing the Monitoring page.
A Destination is a downstream receiver that receives data from Cribl Stream after data processing and transformation. Cribl Stream can send data to many different receivers, such as Cribl Lake, Cribl TCP, Cribl HTTP, Kafka, Kinesis, TCP JSON, Splunk, and others. For this tutorial, you will use Cribl Stream’s built-in DevNull Destination, which simply discards data events. For the purposes of this tutorial, you will use the DevNull Destination because it simulates a real output, providing a quick method for testing initial Cribl Stream setups.
You will also use the Monitoring page to verify that data is flowing through Cribl Stream. The Monitoring page provides real-time data dashboards you can use to monitor performance and resource utilization. See Monitoring for more information about additional uses.
To add a Destination:
On the Worker Groups submenu, select Data > Destinations.
From the list of Destinations, select DevNull.
You can use the search box to jump to the DevNull tile.
On the devnull row, look for the Live indicator under Status. This confirms that the DevNull Destination is ready to accept events.
From the list of Destinations, select the Default Destination at the top. Verify that devnull appears in the Default Output ID column.
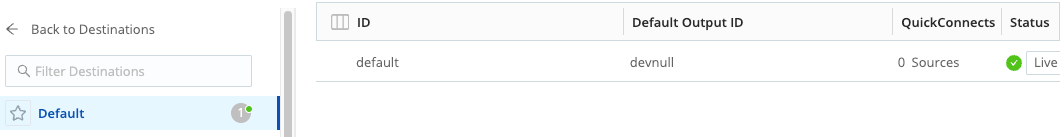
Verify DevNull Destination In the Global Commit menu, select Commit. Write a commit message, such as
Add DevNull Destination. Then, select Commit & Deploy to deploy the changes to your Worker Group.Now that you’ve set up data flow on both sides, check the data dashboards on the Monitoring page. In the sidebar, select Monitoring to open a summary dashboard of the data that is flowing in and out.
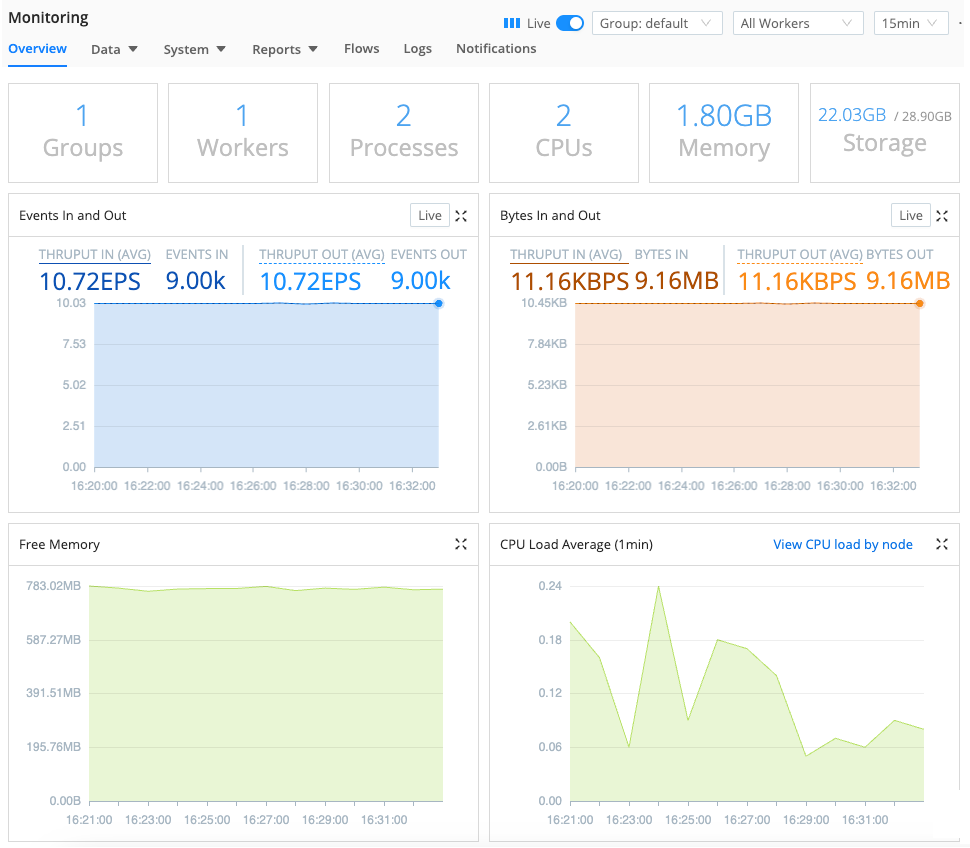
Monitoring dashboard Explore some of the other dashboards by selecting some the other submenus on the Monitoring page.
Now that you have data flowing in and out of Cribl Stream, the rest of the tutorial will show you how to manage that data with Cribl Stream.
Step 3: Add a Pipeline and Capture Sample Data
In this step, you will add a Pipeline to your data flow. A Pipeline contains a logical sequence of Functions, which process data events and perform various operations. Data flows from a Source into a Pipeline, where each Function processes the events in the order they appear. Once processing is complete, the data flows out of the Pipeline to a Destination.

Functions are pieces of JavaScript code that Cribl Stream invokes on each event that passes through a Pipeline. Each Function performs some sort of processing action on data events. This tutorial will explore Functions in more detail later. For now, the focus in this step is on creating a simple Pipeline to get you started.
To add a Pipeline:
On the top bar, select Products. Under Stream, select Worker Groups. Select a Worker Group. If you’re working with a new deployment of Cribl Stream, you will only see one Worker Group named
default. Select that Worker Group or the same Worker Group you used earlier in the tutorial.On the Worker Groups submenu, select Processing > Pipelines.
The Pipelines page has a two-pane view, with a Pipelines list on the left pane and Sample Data controls on the right.
In the Pipelines pane, select Add Pipeline, then select Add Pipeline again.
In the ID field, enter a unique identifier. For this tutorial, use
transform-dataor your own identifier.Save the changes. In the Global Commit menu, select Commit. Write a commit message, such as
Add transform-data Pipeline. Then, select Commit & Deploy to deploy the changes to your Worker Group.
Now that you’ve set up your Pipeline, in the next step you’ll learn how to use the Pipeline Data Preview when working with Pipelines. See Data Preview for more information about using this feature.
Now that you’ve captured some sample data, you will learn how to filter the data in the next step.
Step 4: Capture and Filter Sample Data to Test the Pipeline
In this step, you will learn how to capture sample data from the Pipeline you added in the previous step. The Pipeline Data Preview tool is a useful tool for previewing and testing data transformations as you build them. It gives you confidence that your Pipeline configurations results in the intended output. The Pipeline Data Preview allows you to get data from multiple places, such as inbound streams, uploaded files, and from your computer’s clipboard. See Data Preview for more information.
You will also learn how to further filter this sample data if needed. For this part of the tutorial, you will filter a key-value pair field called marketState. This field contains a value that indicates the U.S. state associated with the data event. The values are state abbreviations, such as FL for Florida, CA for California, and so forth. In this tutorial, you will filter the captured data to only show events that have a marketState value of TX (for Texas). Note that the filter you apply in this step only applies to this specific data capture and has no permanent impact on the data in the Pipeline.
To capture and filter data:
On the Pipelines page, select the
transform-dataPipeline from earlier in the tutorial. Select the Sample Data tab. Then, select Capture Data. Select Capture. Accept the default settings and select Start.When the modal finishes populating with events, select Save as Sample File. In the sample file settings, change the generated file name to a name you’ll recognize, such as
tutorial-sample-data.log.Save your changes and verify that you now see a preview of the captured events. Select the Show more link to expand one or more events.
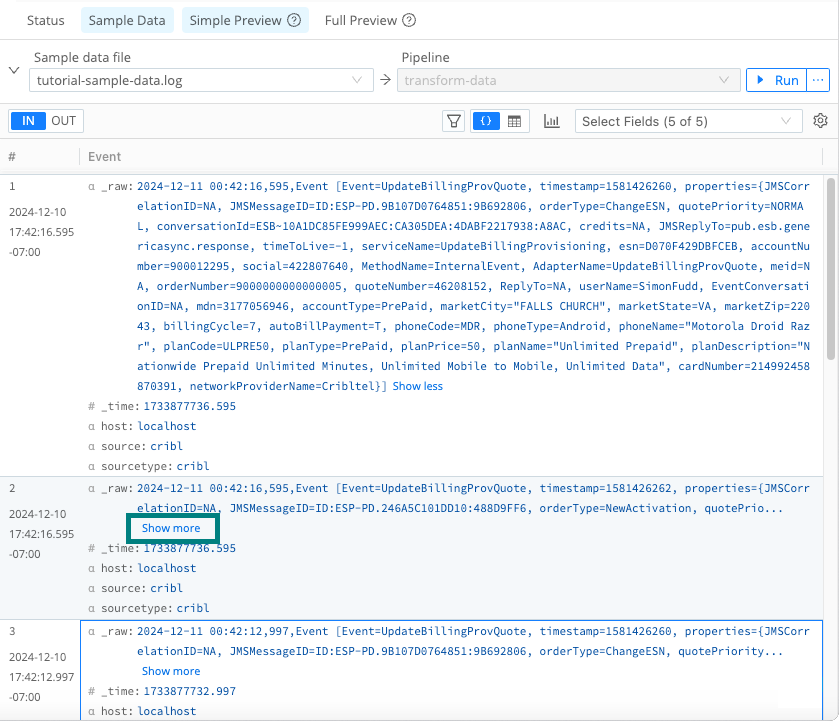
Select “Show more” to expand sample data In the Pipeline Data Preview, find at least one entry with a
marketStatekey-value pair and take note the typical values, which will be the abbreviation for a U.S. state. You may need to select the Show more link to expand events to see this key-value pair.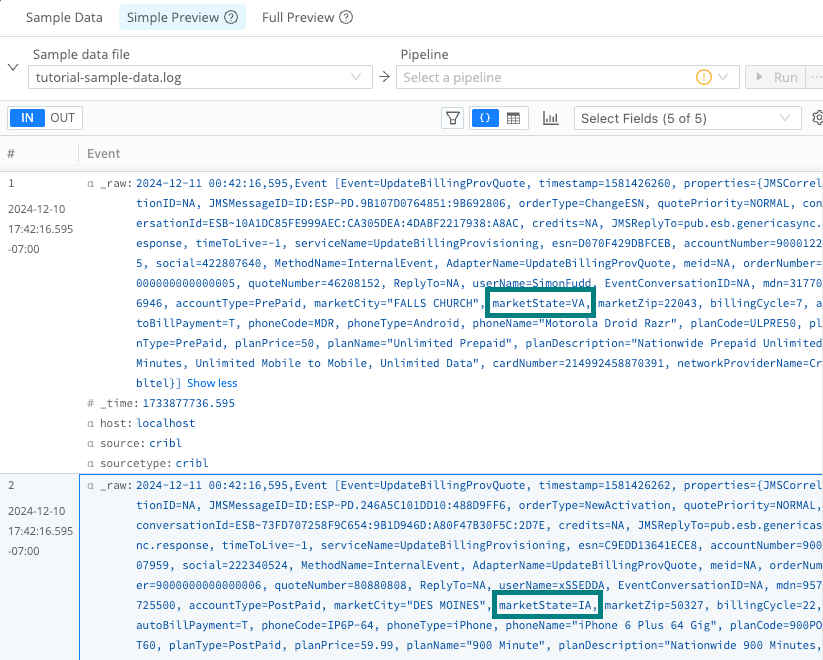
Example marketState key-value pairs Select the Sample Data tab and select Capture Data to capture a new data set.
In the Filter Expression field, replace the default text with this regular expression (regex):
_raw.match(/marketState=TX/).As an experiment, try typing in the expression rather than copying it. As you type, notice how Cribl Stream provides auto-complete suggestions to help make a well-formed JavaScript expression. It will also alert you if your expression is invalid.
Select Capture, then Start.
You might notice that with this filter applied, it takes longer for Cribl Stream to capture 10 matching events. Applying filters can impact the time it takes to capture matching events.
Verify that the sample data only includes data events matching the
marketState=TXfilter.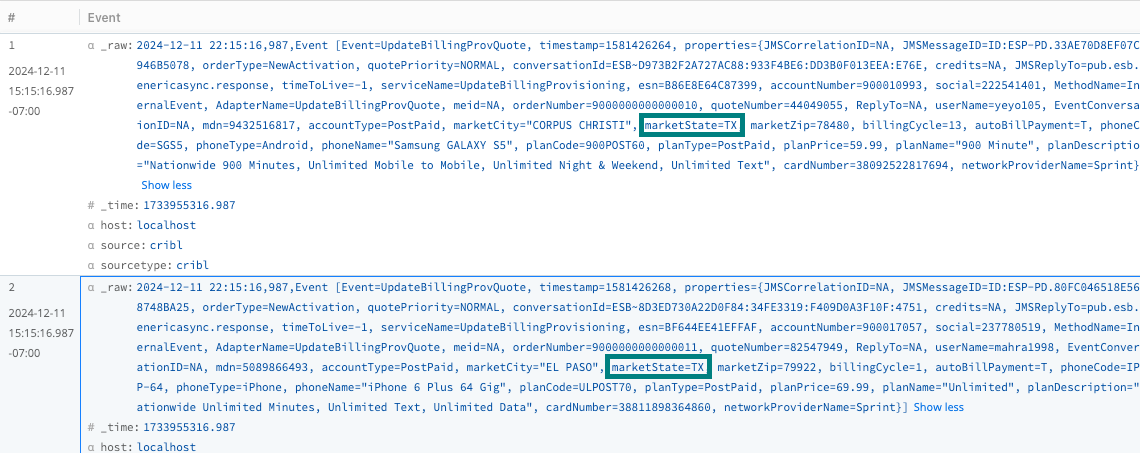
Filtered marketState value You can save this sample data if desired. Otherwise, select Cancel to discard this filtered data.
As you build Pipelines, generate, or upload sample data and check the Pipeline Data Preview when working with Pipelines to validate your changes.
In the next steps, you will learn how to process the original sample data by building out the Pipeline Functions. For the rest of the tutorial, you will use the original, unfiltered capture to verify the impacts of your changes.
Step 5: Add a Mask Function to Redact Sensitive Data
For the next several steps in the tutorial, you will get hands-on experience using Functions to process data events. Functions are pieces of JavaScript code that Cribl Stream invokes on each event that passes through a Pipeline. Each Function performs some sort of processing action on data events.
You can use Functions to perform a variety of different processing operations on your data, such as:
- Reduce the data, trimming it to remove unnecessary fields.
- Enrich the data to add additional fields.
- Normalize data, perhaps transforming it from one data structure to another.
- Redact sensitive data.
- Replay data or generate sample data.
- Transform and transmit data.
The order that Cribl Stream applies the Function to a data event depends on the order in which the Function appears in the Pipeline. You can optionally add filters to Functions to limit their processing scope to matching events only.
In this step, you will use the Mask Function to redact sensitive material from the data events. The data generated by the datagen Source includes a field for fictitious Social Security numbers, which is personally identifiable information (PII) data. The Mask Function can convert sensitive numbers into an encoded MD5 hash or another value. See Mask Function for more information.
To add a Mask Function to your Pipeline:
On the Pipelines page, select the
transform-dataPipeline from earlier in the tutorial. Then, select Add Function. Search forMaskand select it.Under the Masking Rules field, in the Match Regex field, add this regular expression (regex):
(social=)(\d+).This regular expression looks for the string
social=followed by any digits.In the Regular Expression field, paste the following hash function, including the backticks:
`${g1}${C.Mask.md5(g2)}`.Leave the Apply to Fields set to the default setting:
_raw.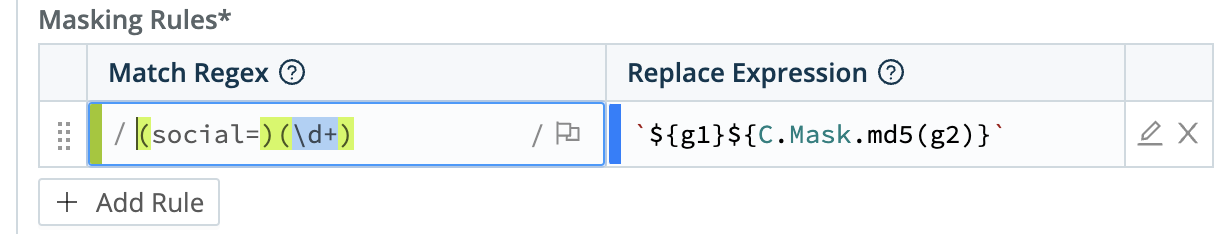
Enter a Masking Rule to hash Social Security numbers Save your changes. Then, confirm that the Pipeline Data Preview pane for the
tutorial-sample-data.loghas switched from the IN tab to the OUT tab. This tab shows you the outbound effect of the Pipeline you just saved. The_rawfield for each event has changed color, indicating that it has undergone some redactions.Select the Show more link to expand at least one event. Verify that the
socialvalues displays a hash.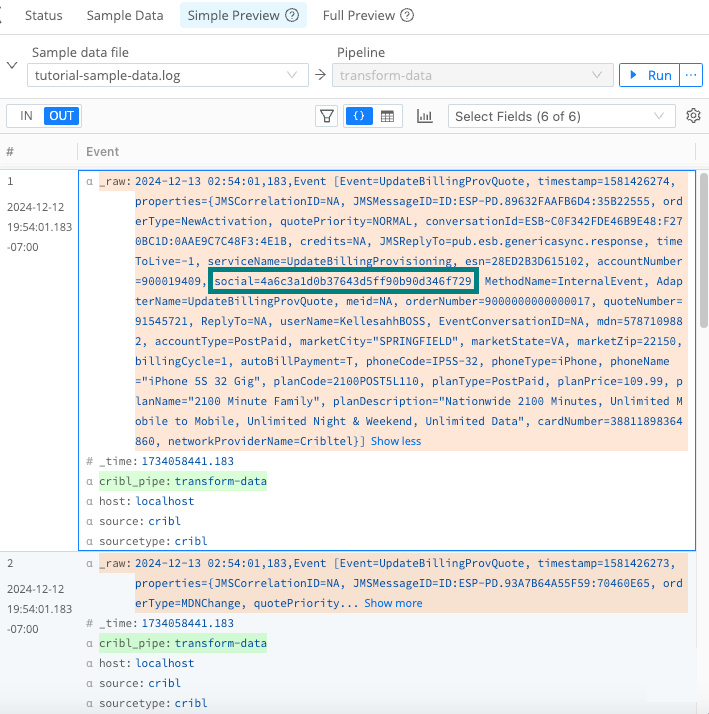
Mask Function and hashed result
Having successfully redacted sensitive data, you can continue exploring Functions more in the next step.
Step 6: Add a Parser Function to Extract Events
The datagen Source generates a lot of raw, unstructured data events. These data events are more useful when converted into key-value pairs and promoted to the field level.
Raw, unstructured data lacks context and organization, making it harder to extract value without significant preprocessing. Rich, structured data is more useful than raw data because it is better organized, enriched, and formatted to make it easier to analyze, process, and derive insights.
In this step, you will use the Parser Function to convert raw data into key-value pairs and promote them to the field level for better data processing and analysis. You can also use the Parser Function to filter fields with certain values. You will use this Function to ignore fields containing the value NA (not applicable). See Parser Function for more information.
To add a Parser Function to your Pipeline:
On the Pipelines page, select the
transform-dataPipeline from earlier in the tutorial. Then, select Add Function. Search forParserand select it.Leave the Operation Mode set to its
Extractdefault.Set the Type to
Key=Value Pairs.Leave the Source Field set to its
_rawdefault.Select Save.
Confirm that the Pipeline Data Preview pane now displays many more fields parsed from
_raw. While in this view, notice also that many fields haveNA(not applicable) values.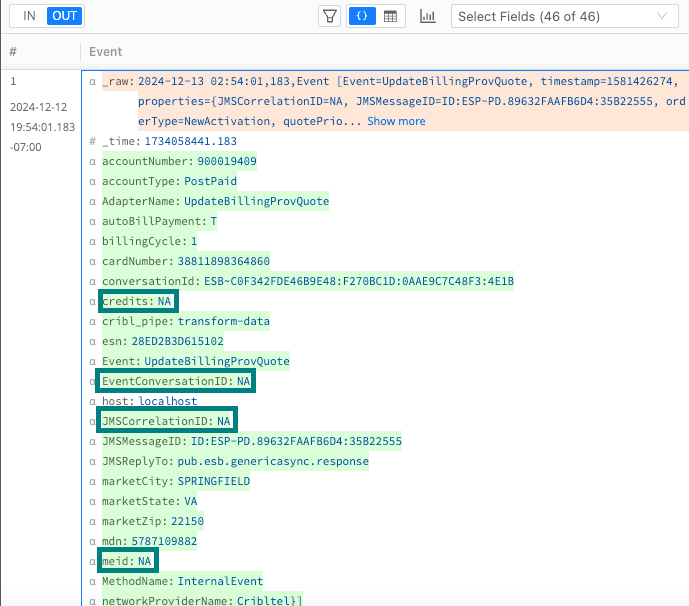
N/A Fields in Parsed Data You can enhance the Parser Function to ignore fields with these values. In the Parser Function Fields Filter Expression field, enter this negation expression:
value!='NA'. Select Save.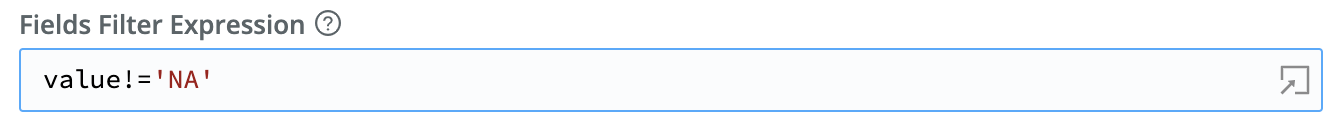
Filter the Parser Function to ignore fields with ‘NA’ values Confirm that the Pipeline Data Preview pane now no longer shows any fields with the value
NA, such ascredits,EventConversationID, andReplyTo. The remaining fields should display meaningful values.If you didn’t see the fields change, toggle the Parser Function off in the Pipeline. Then, select Save and watch the Pipeline Data Preview pane change again. By toggling Functions on and off, you can test and troubleshoot each Function’s effect. Remember to toggle it on again before moving on to the next step in the tutorial.
Now that you’ve added the Parser Function to your Pipeline, your log data is better-organized and less bloated. Continue making additional data improvements in the next step.
Step 7: Add a Eval Function to Enrich Data and Remove Fields
In this step, you will use the Eval Function to enrich and streamline your data. The Eval Function adds or removes fields from events. See Eval Function for more information.
First, you will use this Function add a new field called phoneCompany, which will assign a value of Apple or Other based on the contents of the phoneType field.
Next, you will use the Eval Function to remove the _raw field, which is no longer needed since you promoted its contents to key-value fields in the previous step. Removing this large, redundant field results in cleaner events and reduces the load on downstream resources.
To add an Eval Function to your Pipeline:
On the Pipelines page, select the
transform-dataPipeline from earlier in the tutorial. Then, select Add Function. Search forEval, then select it.Under Evaluate Fields, select Add Field to add a key-value field to the data event that identifies the phone company the phone is associated with.
In the Name field, type
phoneCompany.In the Value Expression field, paste this function:
phoneType.startsWith('iPhone') ? 'Apple' : 'Other'.This JavaScript expression checks if the string
phoneTypestarts withiPhone. If it evaluates to true, it sets the return value toApple. If not, it sets it toOther. Note the use of the operators?and:operators and how strings are enclosed in quotation marks.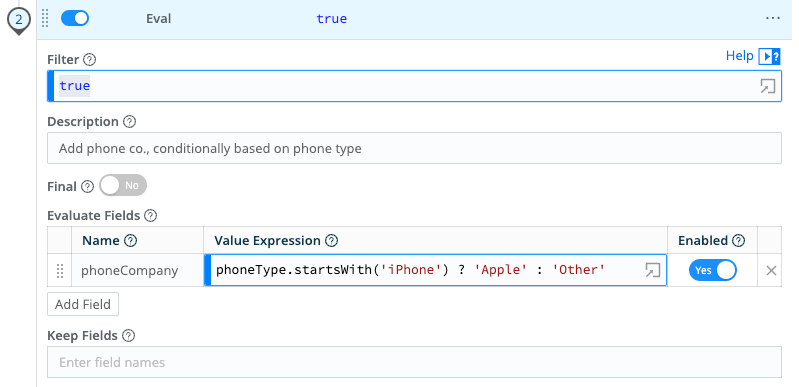
Adding a field to enrich data Save the changes. In the Pipeline Data Preview pane, confirm that data events now contain a
phoneCompanyfield that matches itsphoneType.In the Eval Function in the Remove Fields option, type
_raw.Save the changes and confirm that the Pipeline Data Preview now shows the
_rawfield removed from each event.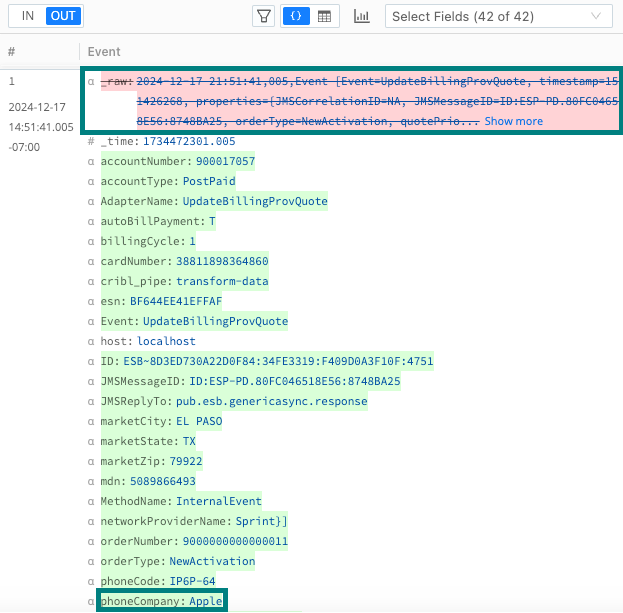
The added phoneCompany field and the removed _raw field
The Eval Function reduced and enriched the data. In the next step, you will learn how to rename fields.
Step 8: Add a Rename Function to Rename Fields
In this step, you will use the Rename Function to change the name of a field. See the Rename Function for more information.
Changing field names can make those fields more user-friendly and also easier to read. If character counts are a concern, this Function can help reduce field characters. You will rename the conversationId field name to the simpler ID instead.
To add a Rename Function to your Pipeline:
On the Pipelines page, select the
transform-dataPipeline from earlier in the tutorial. Then, select Add Function. Search forRename, then select it.Under Rename fields, select Add Field to add a key-value field to the data event.
In the Current name field, type
conversationId.In the New name field, type
ID.Save the changes. In the Pipeline Data Preview pane, confirm that the
conversationIdfield has changed to theIDinstead.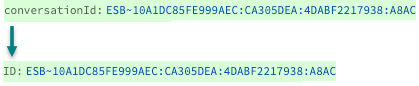
The conversationID field renamed to ID
Your Pipeline is nearly finished. In the next step, you will add the last Function.
Step 9: Add a Drop Function to Remove Unneeded Events
At this point, you have already refined our data substantially. In this step, you will add one last Function to entirely remove events that aren’t of interest for a downstream service. For this tutorial, assume that you don’t need data events for customers who use the prepaid monthly phone service.
You will use the Drop Function to remove any data events for customers with prepaid monthly plans. See Drop Function for more information. You will drop any data events for customers on the prepaid monthly plan by filtering for any events that do not have an accountType value of PostPaid.
To add a Drop Function to your Pipeline:
On the Pipelines page, select the
transform-dataPipeline from earlier in the tutorial. Then, select Add Function. Search forDrop, then select it.In the Filter field, replace the default value with this JavaSscript expression:
accountType!='PostPaid'.This JavaScript expression filters for events that do not have an
accountTypevalue ofPostPaidto find customers who use the prepaid monthly phone service.Select Save.
In the Pipeline Data Preview pane, confirm that events with the
accountTypeofPrePaidare now struck out and faded, which indicates that Cribl Stream will drop them before forwarding the data to a downstream receiver. Verify also that events with theaccountTypeofPostPaidremain.As a reminder, you can turn any Function off by toggling it off in the Pipeline. Then, select Save and watch the Pipeline Data Preview pane change again. By toggling Functions on and off, you can test and troubleshoot each Function’s effect. Remember to toggle it on again before moving on to the next step in the tutorial.
That wraps up the portion of the tutorial that transforms the data. Before moving on, you will learn how to measure the impact of the changes on your outgoing data.
Step 10: Use Pipeline Diagnostics to Measure the Impact of the Pipeline
In the previous steps, you transformed, enriched, and reduced your data. Now, you will learn how to use the Pipeline Diagnostics tool to view detailed statistics that show the impact of each Function in your Pipeline. Depending on your goals, you could use this tool to performance tune your Pipeline to get the desired results.
To measure the impacts of your Pipeline:
On the Pipelines page, select the
transform-dataPipeline from earlier in the tutorial. Then, select Pipeline Diagnostics button.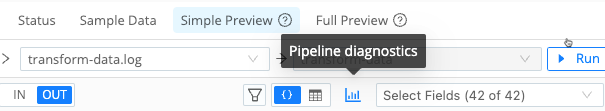
Pipeline Diagnostics Confirm the impact of the Pipeline by looking at the Full Event Length statistic. You should see a substantial percentage reduction in the data volume.
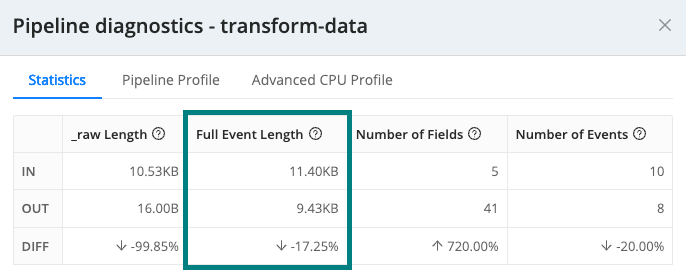
Data reduction quantified Select the Pipeline Profile tab to view the impacts of each Function on the data.
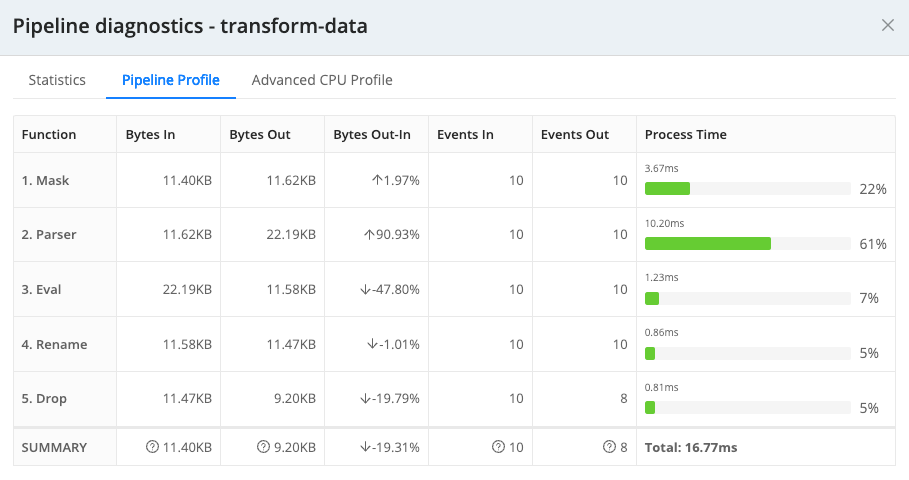
Impact of each Pipeline Function
You can use the Pipeline Diagnostic tool to optimize data flow and right-size the bytes in and out of the Pipeline to get your data to its desired volume threshold.
Step 11: Add and Attach a Route
Up to this point, you have built a complete, functional Pipeline. However, you have only seen its effects on a static data sample that you captured in an earlier step. To get dynamic data flowing through a Pipeline, you need to filter that data in by adding and attaching a Route.
Routes provide a way to connect processing Pipelines to Destinations that send your transformed data out to specific downstream receivers. You can maintain Pipelines and Routes separately, but each Route attaches one Pipeline to one Destination.
To add and attach a Route:
On the Pipelines page, select the
transform-dataPipeline from earlier in the tutorial. Then, select Attach to Route. SelectAdd Route.Enter a unique, meaningful Route Name, such as
tutorial-demo.Leave the Filter field set to its
truedefault, allowing it to deliver all events.A Route delivers events to a Pipeline and acts as the first stage of filtering. In production, you typically configure Routes to filter events based on characteristics such as
source,sourcetype,index,host,_time, or others. The Filter field supports JavaScript expressions, including AND (&&) and OR (||) operators for precise filtering.Set the Pipeline drop-down to the
transform-dataPipeline.Leave the Enable Expression field toggled to the default
No.Toggling Enable Expression to
Yeschanges the Output field to an Output Expression field where you can enter a JavaScript expression for your Destination name.Set Output to either
devnullordefault.In this tutorial, this setting doesn’t matter because the
defaultpoints todevnull. However, in production, you should set this carefully.Leave the Description empty and leave Final toggled to
Yes.With the Route configured, you now need to move the Route so that it processes events first. Select the drag handle for this Route and drag it above the
defaultRoute.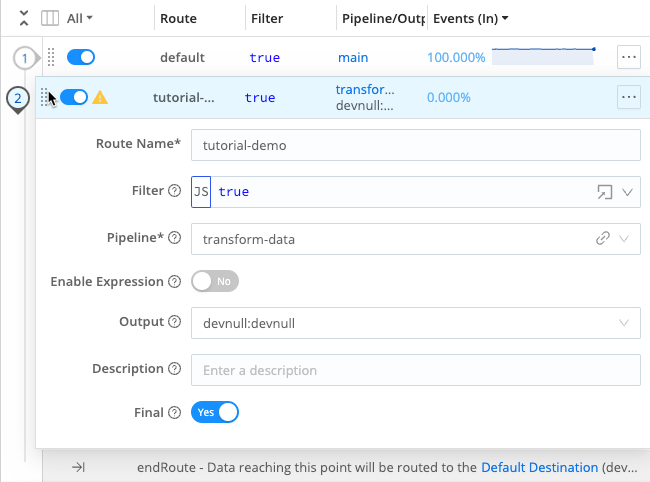
Move the Route Save the changes. In the Global Commit menu, select Commit. Write a commit message, such as
Add Route. Then, select Commit & Deploy to deploy the changes to your Worker Group.Confirm that data is flowing through your new Route by observing the sparklines. If the sparklines show activity, it means your Route is live.
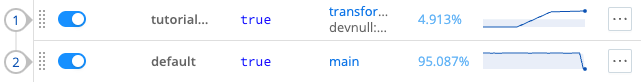
Live Routes show sparklines Now confirm data flow through the whole system you built. Select Monitoring in the sidebar. Then, select Data > Routes and examine the
tutorial-demoRoute to observe activity.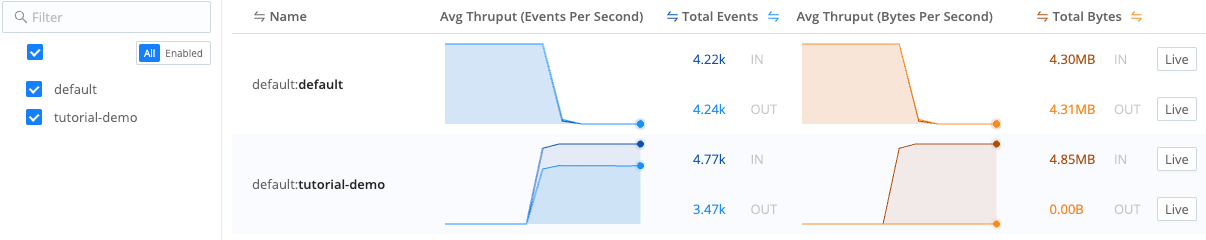
Monitoring data flow through Routes Select Monitoring in the sidebar. Then, select Data > Pipelines and examine the
transform-dataPipeline to observe activity.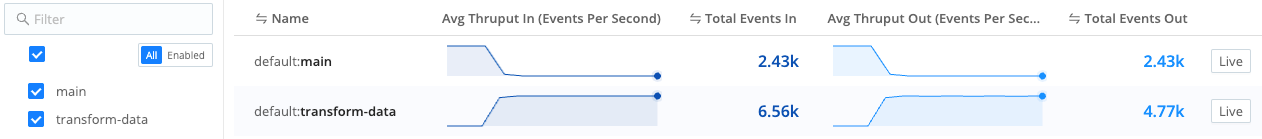
Monitoring data flow through Pipelines
These steps confirm that your Route is ready to begin accepting and processing data. This step concludes the Cribl Stream tutorial. Congratulations!
Conclusion
If you would like, you can optionally shut down your server and stop the datagen Source from generating data:
On the Worker Groups submenu, go to Data > Sources > Datagen.
In the Enabled column, disable the
businesseventdatagen.In your terminal’s
$CRIBL_HOME/bindirectory, shut down the server with:./cribl stop
Congratulations on completing this tutorial. You now have a better sense of the common use cases and potential value that Cribl Stream can provide to your organization to transform, enrich, and reduce your data. Enjoy using Cribl Stream!
What to Do Next
For guided walk-throughs of more advanced Cribl Stream features, consider exploring these additional resources:
Cribl Stream Sandbox: Work through general and specific scenarios in a free, hosted environment, with terminal access and real data inputs and outputs.
Distributed Quick Start: Building on this tutorial that you’ve just completed, launch and configure a Cribl Stream Distributed deployment. You’ll work with a small but realistic model of a fully scalable production deployment.
Use Cases documentation: Bring your own services to build solutions to specific challenges.
Cribl Concept: Pipelines: Video showing how to build and use Pipelines at multiple Cribl Stream stages.
Cribl Concept: Routing: Video about using Routes to send different data through different paths.