


These docs are for Cribl Stream 4.9 and are no longer actively maintained.
See the latest version (4.17).
Publish Metrics
The Publish Metrics Function extracts, formats, and outputs metrics from events.
Usage
Filter: Filter expression (JS) that selects data to feed through the Function. Defaults to true, meaning it evaluates all events.
Description: Simple description about this Function. Defaults to empty.
Final: If toggled to Yes, stops feeding data to the downstream Functions. Defaults to No.
Overwrite: If set to Yes, overwrite previous metric specs. Otherwise, append. Defaults to No.
Metrics
Add Metrics: List of metrics to extract from the event and format. Destinations can pass the formatted metrics to a metrics aggregation platform. Click Add Metrics to add new rows containing the following options:
Event field name: The name of the field (in the event) that contains the metric value. Should contain only letters, numbers, underscores (
_), and.characters (to separate names in nested structures).Metric name expression: JavaScript expression to evaluate the metric field name. Defaults to the Event field name value.
The JavaScript expression will evaluate the metric field name only after the metrics are processed for transport to the Destination. While in the processing Pipeline, the metric name expression appears as a literal.
To have metric names evaluated in preview, enable the Enhance Metric Output setting.
Metric type: Select
Gauge(the default),Counter,Timer,Distribution,Summary, orHistogram. General definitions that can vary across senders:Gauge: A numeric value that can increase or decrease over time - like a temperature or pressure gauge.Counter: A cumulative numeric value - it can only increase over time.Timer: Generally measures how long a given event type takes (duration), and how often it occurs (frequency).Distribution: The statistical distribution of a set of values over a time interval. (This type generally provides raw data, not an aggregation.)Summary: Tracks the count, sum, and average of the values. Optionally, also tracks quantiles across the values.Histogram: Tracks the count, sum, and average of the values. Also groups the observations in their corresponding intervals, or buckets.
Remove Metrics: Optionally, enter a List of field names to look for when removing metrics. Where a metric’s field name matches an element in this list, Cribl Stream will remove that metric from the event.
Dimensions
Add Dimensions: Optional list of dimensions to include in events. Supports wildcards. If you don’t specify metrics, values will be appended to every metric found in the event. When you add a new metric, dimensions will be present only in those new metrics. Defaults to !_* *.
Remove Dimensions: Optional list of dimensions to associate with every extracted metric value. Leave blank if this Function processes output from the Aggregations Function as dimensions will be automatically discovered.
Overwrite: If set to Yes, overwrite previous metric specs. Otherwise, append. Defaults to No.
The Add Dimensions and Remove Dimensions fields support wildcards and negated terms. When you use negated terms, the list is order-sensitive. E.g.,
!foobarbeforefoo*means “All fields that start withfoo, exceptfoobar.” However,!foo*before*means “All fields, except for those that start withfoo.”Cribl Stream can send out multi metrics, but this must be configured on compatible Destinations.
Fields Color Coding
On the right Preview pane’s OUT tab, the Publish Metrics Function adds the following color codes to field labels:
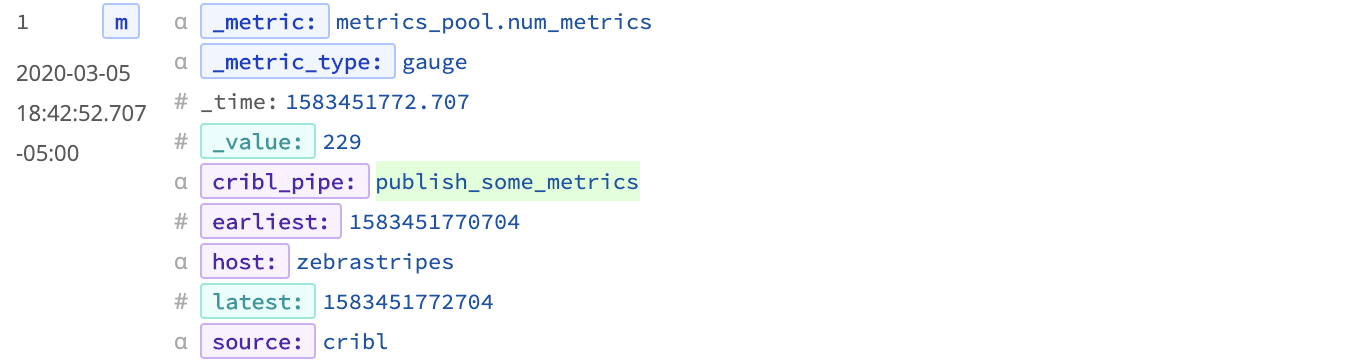
Dimension: purple | Value: cyan (light blue) | Info: dark blue
These are in addition to the color codes applied to field values, which are listed here.
Examples
Scenario A:
Assume we’re working with AWS VPC Flowlog events that have the following structure:
version account_id interface_id srcaddr dstaddr srcport dstport protocol packets bytes start end action log_status
For example:
2 99999XXXXX eni-02f03c2880e4aaa3 10.0.1.70 10.0.1.11 9999 63030 6 6556 262256 1554562460 1554562475 ACCEPT OK
… and we want to use values of packets and bytes as metrics across these dimensions: action, interface_id, and dstaddr.
To reference the packets and bytes fields by name, as 'packets' and 'bytes', our Pipeline will need a Parser Function before the Publish Metrics Function.
Parser Function
Filter: Set as needed
Operation mode: Extract
Type: Extended Log File Format (automatically set when specifying a library)
Library: AWS VPC Flow Logs
Source: _raw
(No need to specify any other fields.)
Publish Metrics Function
Below, the metric_name prefix was arbitrarily chosen. Because there is no JavaScript expression to evaluate - i.e., this is literal text - the strings specified for the Metric name expression will be identical to those in the final metrics data sent to the Destination. See Raw Output below.
Metrics
| Event Field Name | Metric Name Expression | Metric Type |
|---|---|---|
bytes | `metric_name.bytes` | Gauge |
packets | `metric_name.packets` | Gauge |
Dimensions
action interface_id dstaddr
All specified dimension names must align with those from the original event. When you preview the Function’s output, the metrics and dimensions will all have special highlighting to separate them from other fields. Additional highlighting is used to differentiate the metrics from the dimensions. (If one or more metrics/dimensions are not highlighted as expected, check the Function’s configuration.)
Raw Output
metric_name.bytes:262256|g#action:REJECT,interface_id:eni-02f03c2880e4aaa3,dstaddr:10.0.1.11
metric_name.packets:6556|g#action:REJECT,interface_id:eni-02f03c2880e4aaa3,dstaddr:10.0.1.11
Compatible Destinations
All text after the
#symbol represents the dimensions as key-value pairs. In order for dimension data to be included in metrics, the Destination type cannot be standard StatsD. However, StatsD Extended, Splunk, and Graphite do support dimensions.
{
  "action": "REJECT",
  "interface_id": "eni-02f03c2880e4aaa3",
  "dstaddr": "10.0.1.11",
  "metric_name.bytes": 262256,
  "metric_name.packets": 6556,
}Scenario B:
Assume that we want to extract some metrics from specific fields in PANOS logs, whose events have the following structure:
future_use_0,receive_time, serial_number, type, threat_content_type, future_use_1, generated_time, source_ip, destination_ip, nat_source_ip, nat_destination_ip, rule_name, source_user, destination_user, application, virtual_system, source_zone, destination_zone, inbound_interface, outbound_interface, log_action, future_use_2, session_id, repeat_count, source_port, destination_port, nat_source_port, nat_destination_port, flags, protocol, action, bytes, bytes_sent, bytes_received, packets, start_time, elapsed_time, category, future_use_3, sequence_number, action_flags, source_location, destination_location, future_use_4, packets_sent, packets_received, session_end_reason, device_group_hierarchy_level_1, device_group_hierarchy_level_2, device_group_hierarchy_level_3, device_group_hierarchy_level_4, virtual_system_name, device_name, action_source, source_vm_uuid, destination_vm_uuid, tunnel_id_imsi, monitor_tag_imei, parent_session_id, parent_start_time, tunnel_type, sctp_association_id, sctp_chunks, sctp_chunks_sent, sctp_chunks_received
For example:
Jan 10 10:19:15 DMZ-internal.nsa.gov 1,2019/01/10 10:19:15,001234567890002,TRAFFIC,drop,2304,2019/01/10 10:19:15,209.118.103.150,160.177.222.249,0.0.0.0,0.0.0.0,InternalServer,,,not-applicable,vsys1,inside,z1-FW-Transit,ethernet1/2,,All traffic,2019/01/10 10:19:15,0,1,63712,443,0,0,0x0,udp,deny,60,60,0,1,2019/01/10 10:19:15,0,any,0,0123456789,0x0,Netherlands,10.0.0.0-10.255.255.255,0,1,0,policy-deny,0,0,0,0,,DMZ-internal,from-policy,,,0,,0,,N/A,0,0,0,0,1202585d-b4d5-5b4c-aaa2-d80d77ba456e,0
Our goal is to use the four values of bytes_sent, bytes_received, packets_sent, andpackets_received as metrics across these dimensions: destination_ip, inbound_interface, outbound_interface, and destination_port.
Here again, our Pipeline will need a Parser Function before the Publish Metrics Function.
Parser Function
Filter: Set as needed
Operation mode: Extract
Type: Extended Log File Format (automatically set when specifying a Library)
Library: Palo Alto Traffic
Source: _raw
(No need to specify any other fields.)
Publish Metrics Function
Set up the Publish Metrics Function as follows.
Metrics
| Event Field Name | Metric Name Expression | Metric Type |
|---|---|---|
bytes_sent | `metric.${host}.bytes_sent` | Counter |
bytes_received | `metric.${host}.bytes_rcvd` | Counter |
packets_sent | `metric.${host}.pkts_sent` | Counter |
packets_received | `metric.${host}.pkts_rcvd` | Counter |
Added Dimensions
destination_ip, inbound_interface, outbound_interface, destination_port
Raw Output
metric.10.10.12.192.bytes_sent:60|c|#destination_ip:160.177.222.249,inbound_interface:ethernet1/2,destination_port:443 metric.10.10.12.192.bytes_rcvd:0|c|#destination_ip:160.177.222.249,inbound_interface:ethernet1/2,destination_port:443 metric.10.10.12.192.pkts_sent:1|c|#destination_ip:160.177.222.249,inbound_interface:ethernet1/2,destination_port:443 metric.10.10.12.192.pkts_rcvd:0|c|#destination_ip:160.177.222.249,inbound_interface:ethernet1/2,destination_port:443
Here again, all text after the # symbol represents the dimensions as key-value pairs. (See the Compatible Destinations note above.) Unlike the first example, this example uses JavaScript expressions, which you can see evaluated in the raw output where the ${host} has been converted to 10.10.12.192.