


Destinations
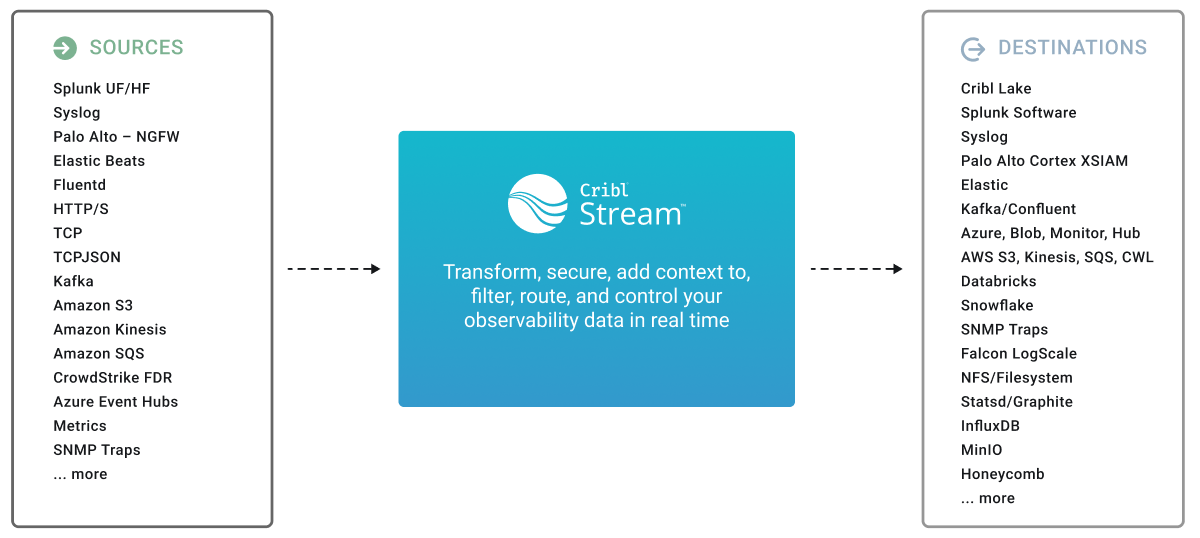
Cribl Stream can send transformed data to various Destinations, including Cribl HTTP, Cribl TCP, Cribl Lake, Elasticsearch, Amazon Kinesis, Amazon S3 and other object stores, Prometheus and compatible services, InfluxDB, Splunk, Snowflake, Databricks, TCP JSON, and many others.
Destinations can write data to either IPv4 or IPv6 addresses.
Destination are grouped into categories that define how they handle unreachable outputs (backpressure events) and their load-balancing capabilities.
Destination Categories
Destinations can be divided into streaming and non-streaming: those that accept events in real time, and those that batch them from a staging directory.
Other than that, each Destination can belong to one of the following (non-exclusive) categories:
Streaming and Non-Streaming Destinations
Streaming and non-streaming Destination differ in the way they receive events:
- Streaming Destinations accept events in real time.
- Non-streaming Destinations receive events in batches from a staging directory.
Non-Streaming Destinations
Non-streaming Destinations make use of the staging directory, and have specific behavior regarding batching events into files.
Staging Directory
With non-streaming Destinations, Cribl Stream uses a staging directory in the local filesystem to format and write outputted events before sending them to configured Destinations. After a set of conditions is met, data is compressed and then moved to the final Destination.
To reduce costs when the staging directory is also the final directory, Cribl Stream avoids iterating through all the files within a directory by keeping an inventory of open (in progress) files in the staging directory’s root. At startup, Cribl Stream will check for any leftover files in progress from prior sessions, and will ensure that they’re moved to their final Destination. The process of moving to the final Destination is delayed after startup (default delay: 30 seconds). Processing of these files is paced at one file per service period (which defaults to 1 second).
In Cribl.Cloud, using a staging directory is only available on customer-managed hybrid Workers.
Batching Conditions
In non-streaming delivery, a file is closed and rolled out when it reaches its configured maximum:
- Size
- Open time
- Idle time
If a new file needs to be open, Cribl Stream will enforce the maximum number of open files by closing files in the order in which they were opened.
Filesystem-based Destinations
Some Destinations are Filesystem-based, which means they receive files on disk from a staging directory and batch them in a queue. When a batch of events is ready for transmission, Cribl Stream closes the file, optionally compresses it, and transmits the file to the downstream service. Filesystem-based Destinations do not support persistent queues.
Load-balanced Destinations
Certain Destinations offer built-in load-balancing capabilities.
Available Destinations
Cribl Stream supports the following Destinations. You can configure proxy servers for all HTTP-based Destinations.
| Destination | Protocol | Streaming | Filesystem-Based | Load-Balanced |
|---|---|---|---|---|
| Amazon S3 Compatible Stores | HTTP/S | Non-streaming | ✓ | |
| Amazon CloudWatch Logs | HTTP/S | Streaming | ||
| Data Lakes > Cribl Lake | HTTP/S | Non-Streaming | ||
| Data Lakes > Amazon S3 | HTTPS only | Non-Streaming | ✓ | |
| Data Lakes > Amazon Security Lake | HTTP/S | Non-Streaming | ✓ | |
| Amazon Kinesis Data Streams | HTTP/S | Streaming | ||
| Amazon MSK | TCP | Streaming | ||
| Amazon SQS | HTTP/S | Streaming | ||
| Azure Blob Storage | HTTPS only | Non-Streaming | ✓ | |
| Azure Data Explorer | HTTPS only | Streaming or non-streaming | ||
| Azure Event Hubs | TCP | Streaming | ||
| Azure Monitor Logs | HTTPS only | Streaming | ||
| Microsoft Sentinel | HTTP/S | Streaming | ||
| Alibaba OSS | HTTP/S | Non-Streaming | ✓ | |
| AlphaSOC | HTTP/S | Non-Streaming | ✓ | |
| ClickHouse | HTTP/S | Streaming | ✓ | |
| Cloudflare R2 | HTTP/S | Non-Streaming | ✓ | |
| Cloudian HyperStore | HTTP/S | Non-Streaming | ✓ | |
| Cortex XSIAM | HTTP/S | Streaming | ||
| Confluent Cloud | TCP | Streaming | ||
| CrowdStrike Falcon LogScale | HTTPS only | Streaming | ||
| CrowdStrike Falcon Next-Gen SIEM | HTTPS only | Streaming | ||
| Datadog | HTTPS only | Streaming | ||
| Databricks | Non-Streaming | ✓ | ||
| Dell PowerScale OneFS | HTTP/S | Non-Streaming | ✓ | |
| Dynatrace HTTP | HTTP/S | Streaming | ✓ | |
| Dynatrace OTLP | HTTP/S | Streaming | ||
| Elastic Cloud | HTTPS only | Streaming | ✓ | |
| Elasticsearch | HTTP/S | Streaming | ✓ | |
| Exabeam | HTTP/S | Non-Streaming | ✓ | |
| Filesystem/NFS | Non-Streaming | ✓ | ||
| Google Cloud Chronicle API | HTTPS only | Streaming | ||
| Google Cloud Logging | HTTPS only | Streaming | ||
| Google Cloud Pub/Sub | HTTPS only | Streaming | ||
| Google Cloud Storage | HTTPS only | Non-Streaming | ✓ | |
| Google SecOps | HTTPS only | Streaming | ||
| Grafana Cloud | HTTP/S | Streaming | ||
| Graphite | TCP or UDP | Streaming | ||
| Honeycomb | HTTPS only | Streaming | ||
| InfluxDB | HTTP/S | Streaming | ||
| Kafka | TCP | Streaming | ||
| Loki | HTTP/S | Streaming | ||
| Microsoft Fabric Real-Time Intelligence | TCP | Streaming | ||
| MinIO | HTTP/S | Non-Streaming | ✓ | |
| NetFlow | UDP | Streaming | ||
| New Relic Events | HTTPS only | Streaming | ||
| New Relic Logs & Metrics | HTTPS only | Streaming | ||
| Nutanix Objects | HTTP/S | Non-Streaming | ✓ | |
| OpenTelemetry (OTel) | gRPC or HTTP/S | Streaming | ||
| Prometheus | HTTP/S | Streaming | ||
| Scality | HTTP/S | Non-Streaming | ✓ | |
| SentinelOne AI SIEM | HTTP/S | Streaming | ||
| SentinelOne DataSet | HTTPS only | Streaming | ||
| ServiceNow Cloud Observability | gRPC or HTTP/S | Streaming | ||
| SignalFx | HTTPS only | Streaming | ||
| SNMP Trap | UDP | Streaming | ||
| Splunk HEC | HTTP/S | Streaming | ✓ | |
| Splunk Load Balanced | TCP | Streaming | ✓ | |
| Splunk Single Instance | TCP | Streaming | ||
| StatsD | TCP or UDP | Streaming | ||
| StatsD Extended | TCP or UDP | Streaming | ||
| Storj | HTTP/S | Non-Streaming | ✓ | |
| Sumo Logic | HTTP/S | Streaming | ||
| Syslog | TCP or UDP | Streaming | ✓ (TCP only) | |
| TCP JSON | TCP | Streaming | ✓ | |
| Wavefront | HTTPS only | Streaming | ||
| Webhook | HTTP/S | Streaming | ✓ | |
| Wiz Defend | HTTP/S | Streaming | ✓ |
You can adapt the Amazon S3 Compatible Stores Destination to send data to downstream services like Snowflake, for which Cribl Stream currently has no preconfigured Destination. For details, please contact Cribl Support.
Internal Destinations
Internal Destinations are special-purpose Destinations that route data within your Cribl Stream deployment, or among Workers across distributed or hybrid Cribl.Cloud deployments. The following internal Destinations are available:
- Default: Specify a default output from among your configured Destinations.
- Output Router: A “meta-Destination.” Configure rules that route data to multiple configured Destinations.
- DevNull: Simply drops events. Preconfigured and active when you install Cribl Stream, so it requires no configuration. Useful for testing.
- Cribl HTTP: Send data among peer Worker Nodes over HTTP. Streaming and load-balanced.
- Cribl TCP: Send data among peer Worker Nodes over TCP. Streaming and load-balanced.
- Cribl Search: Send data from Worker Groups directly to Cribl Search over HTTP. Streaming and load-balanced.
- SpaceOut: This experimental Destination is undocumented. Be careful!
Data Delivery to Unreachable Destinations
Cribl Stream attempts to deliver data to all Destinations that are configured to receive it at least once. When a Destination is unreachable, there are three possible behaviors:
- Block - Cribl Stream will block incoming events.
- Drop - Cribl Stream will drop events addressed to that Destination.
- Queue - To prevent data loss, Cribl Stream will write events to a persistent queue disk buffer, then forward them when a Destination becomes available. (Available on several streaming Destinations.)
For further information about backpressure (a situation when a Destination receives more data than it can send), see Destination Backpressure Triggers.
You can configure your desired behavior through a Destination’s Backpressure Behavior drop-down. Where other options are not displayed, Cribl Stream’s default behavior is Block. For details about all the above behaviors and options, see Persistent Queues.
To learn how backpressure affects upstream Sources when persistent queue is not enabled, see Backpressure Impacts to Sources.
How Destinations Count Bytes Sent
Cribl Destinations record bytes sent per event by setting an internal field, __outLen, at the point where the Destination serializes or writes the payload for delivery. The calculation varies by Destination type. __outLen reflects uncompressed bytes. Compression is applied after __outLen is set, so metrics represent logical (uncompressed) size rather than on-the-wire compressed size.
Some Destinations can operate in multiple transport/mode categories. For example, Azure Data Explorer supports both streaming and batching, and OpenTelemetry and Dynatrace OTLP support HTTP and gRPC. These Destinations have clarifications in parenthesis in the Destinations column of the Byte Calculations table.
Byte Calculations
| Destination Category | Byte Calculations | Destinations |
|---|---|---|
HTTP and API-based Destinations | Measures the size of the data payload sent in the HTTP request (the uncompressed event data), calculated either event-by-event or during batch creation. | Amazon CloudWatch Logs, Azure Data Explorer (streaming mode), CrowdStrike Next-Gen SIEM, Cribl HTTP, Dynatrace (HTTP), Dynatrace (OTLP HTTP), Elastic, Elastic Cloud, Exabeam, Grafana Cloud, Google Cloud Logging, Google Pub/Sub, Honeycomb, Humio (HEC), InfluxDB, Microsoft Fabric, Microsoft Sentinel, New Relic (Events), OpenTelemetry (HTTP), SentinelOne AI SIEM, ServiceNow, Splunk HEC, Subscription, Wavefront |
| Batched HTTP serialization | Measures the event size during batch assembly. The final byte count is assigned from the size of the event’s data within the batched request body. | Azure Monitor Logs, ClickHouse, Datadog, DataSet, Google Cloud Chronicle, Grafana Loki, Palo Alto Cortex XSIAM, Sumo Logic, Webhook |
| Object storage | Measures the size of the content before compression and writing to the storage medium. | Amazon S3, Amazon Security Lake, Azure Blob Storage, Azure Data Explorer (batching mode), Cloudflare R2, Cribl Lake, Databricks, Disk Spool, DL S3, Filesystem, Google Cloud Storage, MinIO, Ring |
| TCP-based outputs | Measures the actual bytes written to the TCP network buffer for each event. | Cribl TCP, Graphite, Syslog (TCP), TCP JSON |
| Splunk Forwarder (S2S) | Measures the raw byte size for data events. Metric events are counted as a fixed 150 bytes each. | Splunk (Load Balanced), Splunk (S2S) |
| OpenTelemetry (OTLP/gRPC) | Measures the size of the data after it has been formatted (serialized) into the protobuf structure for gRPC transmission. | Dynatrace (OTLP gRPC), OpenTelemetry (OTLP gRPC) |
| Streaming and message queues | Measures the total size of the message, including the key, value (payload), and any headers. | Amazon Kinesis Data Streams, Amazon MSK, Amazon SQS, Apache Kafka, Azure Event Hubs, Confluent Cloud |
| Metrics line senders | Measures the byte size of the formatted metric line at the moment it is prepared for output. | StatsD Extended, StatsD |
| Metrics platforms | Measures the size based on the metric components and series metadata, as defined by the specific platform. | New Relic (Metrics), Prometheus, SignalFx |
| UDP-based outputs | Measures the buffer size multiplied by the number of endpoints (since UDP sends copies to all Destinations). | NetFlow, SNMP, Syslog (UDP) |
| Routing | No direct size tracking. The size is determined by the downstream outputs that the router forwards the data to. | Output Router |