


Distributed Quick Start
This tutorial builds on our Cribl Stream Tour and Getting Started Guide by walking you through a Distributed deployment - Cribl Stream’s typical deployment type for production.
For concepts and deeper details underlying the techniques presented here, see Distributed Deployment.
Requirements
To exercise these distributed features, you’ll need the following prerequisites.
Licenses and Instances
This tutorial is tiered to accommodate different Cribl Stream license types:
With a Cribl Stream Free, One, or Standard license, you’ll install three Cribl Stream instances on one or multiple physical or virtual machines - one Leader Node, and two Worker Nodes.
To do the optional section on adding and managing multiple Worker Groups, you’ll need an Enterprise or Sales Trial license/plan.
Basic Setup
Basic building blocks are identical to the Getting Started Guide. Please refer to the following sections of that tutorial for details, as needed:
To set up the multiple instances you’ll need, choose among the options below in Three Instances, Pick Any Medium. But first, let’s lay out the division of labor in a single Worker Group.
Distributed Deployment (Identical Workers)
A Distributed deployment enables Cribl Stream to scale out to handle higher data volumes, load-balancing with failover, and parallel data processing based on conditional mapping and routing.
A single Leader Node manages multiple Worker Nodes. The Leader distributes and updates configuration on the Workers, handles version control, and monitors the Workers’ health and activity metrics. The Workers do all the data processing.
Here, we’ll show how this works by configuring a Leader and two Workers. This configuration is compact, and can be demonstrated without an Enterprise (or other paid) license/plan. But you can extrapolate the same technique to setting up enterprise-scale deployments of hundreds of Workers, to handle petabytes of data.
Cribl Stream Free, One, and Standard licenses support only a single Worker Group (named
default), so in this example, all Workers share identical configuration. With an Enterprise license/plan, you can organize Workers into multiple Groups, with varying configurations to handle scenarios like on-prem versus cloud tech stacks, or data centers in different geographic locations. For details, see Worker Groups - What Are They and Why You Should Care.
Three Instances, Pick Any Medium
You’ll need to deploy three Cribl Stream instances - with SSH access - on one or more physical machines, virtual machines, or containers. If you haven’t already provisioned this infrastructure, you have several alternatives, listed in the following subsections:
Pick whichever approach will make it easiest for you to get the infrastructure launched - based on familiarity, preference, or availability.
We Don’t Need No Stinkin’ Permissions Errors!
Cribl’s Docker containers come with Cribl Stream preinstalled. If you select any other option, be sure to both install and run Cribl Stream as the same Linux user. (For details on creating a new user - addressing both systemd and initd distro’s - see Enabling Start on Boot.)
Docker Containers
You can use the Docker Compose (docker-compose.yml) file below to easily stand up a Cribl Stream Distributed deployment of a Leader and multiple Workers on one machine.
Before you use the Docker Compose file
- Open the
docker-compose.ymlfile in a text editor.- Replace both instances of
INSERT_TOKENwith a unique, secure token value.- Save the updated
docker-compose.ymlfile.
version: '3.8'
services:
  leader:
    image: cribl/cribl:latest
    environment:
      - CRIBL_DIST_MODE=leader
      - CRIBL_DIST_LEADER_URL=tcp://INSERT_TOKEN@0.0.0.0:4200
      - CRIBL_VOLUME_DIR=/opt/cribl/config-volume
    ports:
      - "19000:9000"
    volumes:
      - "~/cribl-config:/opt/cribl/config-volume"
  workers:
    image: cribl/cribl:latest
    depends_on:
      - leader
    environment:
      - CRIBL_DIST_MODE=worker
      - CRIBL_DIST_LEADER_URL=tcp://INSERT_TOKEN@leader:4200
    ports:
- 9000When you run the docker compose command, the ~/cribl-config local directory is created automatically for use as a persistent configuration store for Cribl Stream.
If you prefer to use ephemeral storage, you can delete line 8 (the CRIBL_VOLUME_DIR definition) and lines 11-12 (the volumes configuration) before running the docker compose command. But this will make it hard to stop and restart the same infrastructure, if you want to do the tutorial in chunks.
To deploy a Leader Node, plus (for example) two Workers already configured and wired up to the Leader, use this command:
docker compose up -d --scale workers=2To deploy a different number of Workers, just change the workers=2 value. By default, the above command pulls the freshest stable image (tagged cribl/cribl:latest) from Cribl’s Docker Hub. It defaults to the following URLs and ports:
- Leader URL:
http://localhost:19000 - Worker URLs:
http://localhost:<automatically-assigned-host-ports>
If you’re running the container itself on a virtual machine, replace localhost with the VM’s IP address. The automatic assignment of available host-OS ports to the Workers prevents port collisions. Within the Docker container, these ports will forward over TCP to port 9000. To see the ports assigned on the OS, enter:
docker ps
You should see results like these:
CONTAINER ID   IMAGE                COMMAND                  CREATED          STATUS          PORTS                                         NAMES
a3de9ea8f46f   cribl/cribl:latest   "/sbin/entrypoint.sh..."   12 seconds ago   Up 10 seconds   0.0.0.0:63411->9000/tcp                       docker_workers_1
40aa687baefc   cribl/cribl:latest   "/sbin/entrypoint.sh..."   12 seconds ago   Up 10 seconds   0.0.0.0:63410->9000/tcp                       docker_workers_2
df362a65f7d1 cribl/cribl:latest "/sbin/entrypoint.sh..." 13 seconds ago Up 11 seconds 0.0.0.0:19000->9000/tcp, :::19000->9000/tcp docker_master_1The PORTS column shows the host-OS ports on the left, forwarding to the container-internal ports on the right. You can use the docker_workers_N ports if you want to log directly into Workers. In the above example:
- Worker1 URL:
http://localhost:63411 - Worker2 URL:
http://localhost:63410
If your Leader is crashing with two Workers, make sure you are allocating enough memory to Docker.
Once your three instances are running, proceed to Configure Leader Instance.
Curl
Use our Download page’s curl command to directly install Cribl Stream onto your chosen infrastructure.
For x64 processors, use: curl -Lso - $(curl https://cdn.cribl.io/dl/latest-x64) | tar zxv
For ARM64 processors:
curl -Lso - $(curl https://cdn.cribl.io/dl/latest-arm64) | tar zxv
Once you’ve configured the first Cribl Stream instance as a Leader, you can bootstrap Workers from the Leader. Or you can create Workers (with tags) from the Leader, using a curl command of this form:
curl 'http://<leader-ip-or-hostname>:9000/init/install-worker.sh?token=<token>&tag=<tag1>&tag=<tag2>'
For example: curl 'http://localhost:9000/init/install-worker.sh?token=<token>&tag=dev&tag=test''
Once your three instances are running, proceed to Configure Leader Instance.
Amazon Lightsail
Amazon Lightsail provides a quick, simple way to deploy Cribl Stream to AWS instances. Amazon’s Get Started with Linux/Unix-based Instances in Amazon Lightsail tutorial walks you through setting up your instances and connecting via SSH.
- The free (first month) tier is all you need for this tutorial.
- As the “platform,” Cribl recommends selecting Amazon Linux 2 (default CentOS).
- Lightsail doesn’t support IAM roles assigned to instances, or advanced load balancing, but it’s adequate for this tutorial, which is not a production deployment.
Once your three instances are running, proceed to Configure Leader Instance.
AWS/EC2 (CloudFormation Optional)
You can deploy Cribl Stream’s AWS EC2 instances using Cribl’s CloudFormation template, see our AWS/EC2 Quick Start Guide on GitHub. Follow the Cribl Stream Distributed instructions. (You’ll be responsible for the costs of your AWS infrastructure.)
If you prefer to deploy your own EC2 instances, the free tier is fine for this tutorial. Cribl recommends selecting Amazon Linux 2 (default CentOS) AMIs. Relevant instructions are linked below.
See any of these AWS Docs for EC2 deployment:
See these AWS instructions for SSH access:
Once your three instances are running, proceed to Configure Leader Instance.
Kubernetes/Helm
Use Cribl’s Helm charts to deploy Kubernetes pods, then proceed to the next section:
Configure Leader Instance
Once you’ve set up your Leader and Worker instances via your chosen approach above, you’re ready to configure these instances and their communication.
If you used an installation option like Docker Containers above, it has already preconfigured all three instances for you. This section and the next Configure Workers section will show you how to verify, and/or modify, these preset configurations.
If you want to jump ahead, your next required configuration step is Add a Source, further down.
Configure the first instance in Leader mode, and open port 4200.
- Log into the Leader. Depending on the deployment method you chose, this will be at
http://<localhost-or-IP-address>:9000orhttp://<localhost-or-IP-address>:19000. Use the defaultadmin/admincredentials. - Complete the registration form.
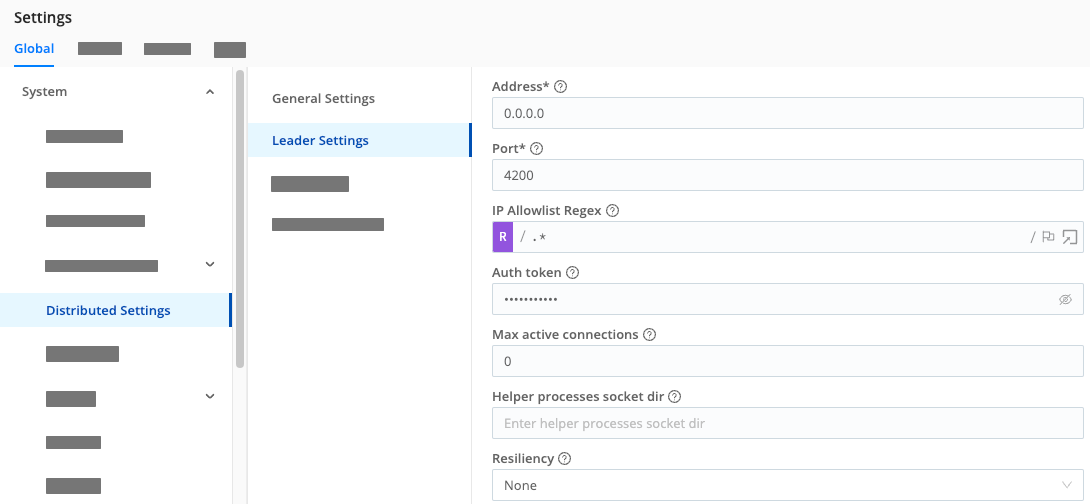
- In the sidebar, select Settings, then Global.
- Select Distributed Settings, then General Settings.
- In Mode, choose
Leader. - Select Leader Settings, and make sure the Port is set to
4200. (This port must be open for Workers to communicate with the Leader.) - Select Save to restart the Cribl server in Leader mode.
Keep the Leader’s tab open, so that we can verify connectivity with the Workers after configuring them (in the next section).
- Optional but recommended: In the sidebar, select Worker Groups. Then enable Teleport for your Group(s). This way, you will be able to click through from the Leader’s Workers page to view and manage each Worker’s UI, distinguished by a purple border. (This option handles authentication for you, so you don’t need to manage or enter the Workers’ credentials.)
Configure Workers
Next, configure the two other instances as Workers that report to the Leader to receive processing instructions. We’ll configure one instance through the UI, and (optionally) bootstrap the other from the Leader.
Configure Worker via UI
- Log into the first Worker instance. Depending on the deployment method you chose, this will be at
http://<localhost-or-IP-address>:9000or at:http://<localhost-or-IP-address>:<automatically-assigned-host-port>. Use the defaultadmin/admincredentials. - Complete the registration form, if displayed.
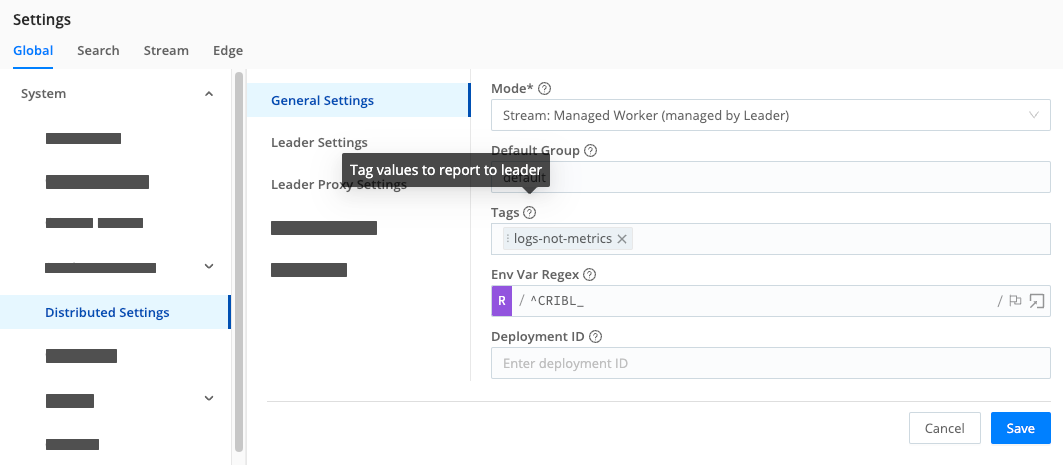
- In the sidebar, select Settings, then Global.
- Select Distributed Settings, then General Settings.
- In Mode, choose
Stream: Managed Worker (managed by Leader). - Leave other settings on this tab unchanged, including Default Group:
default. (This is the literal name of the single Worker Group available with free licenses.) - Select Leader Settings, and make sure the Address matches the domain of the Leader you previously configured.
- Still in Leader Settings, display the Auth token value. Optionally, you can change this from the default.
- Leave other settings unchanged, and select Save to restart this instance as a managed Worker.
Bootstrap Worker from Leader
You can (if you choose) configure the second Worker instance using exactly the same procedure you used just above. But here, we’ll offer you a simplified version of Cribl Stream’s Bootstrapping Workers from Leader procedure for downloading the config from the Leader to the second Worker:
First, switch to the terminal/console of the instance you’ve reserved for this second Worker.
Next, if you didn’t change the default Auth token value when you previously configured the Leader, run this command as root user:
curl http://<leader-hostname-or-IP>:9000/init/install-worker.sh | sh -If you cannot run as root, insert sudo as you pipe to the shell:
curl http://<leader-hostname-or-IP>:9000/init/install-worker.sh | sudo sh -To instead pipe to a bash shell:
curl http://<leader-hostname-or-IP>:9000/init/install-worker.sh | [sudo] bash -If you substituted a custom Auth token value on the Leader, enter:
curl http://<leader-hostname-or-IP>:9000/init/install-worker.sh?token=<your-custom-token> | [sudo] sh -Or, for bash:
curl http://<leader-hostname-or-IP>:9000/init/install-worker.sh?token=<your-custom-token> | [sudo] bash -The bootstrap script will install Cribl Stream into
/opt/criblon the target instance.
Verify Workers’ Communication with the Leader
With both Workers configured, next make sure they’re visible to the Leader.
- Return to the Leader instance you previously configured.
- In the sidebar, select Workers.
- You should now see both Workers, mapped to the
defaultGroup.
If one or both Workers are missing, repeat the preceding Configure Worker via UI and/or Bootstrap Worker from Leader procedures until the Workers show up.
Otherwise, if both Workers are present, we can now configure a few more resources to get data flowing through this distributed setup.
If you’re interested in details about the communication among Cribl Stream instances, see How Do Workers and Leader Work Together.
Once you’ve configured a Worker to point to the Leader Node, the Leader will assign the Worker a new, random admin password. This secures each Worker from unintended access. If you need to reconfigure the Worker later, you can either:
- Enable the Leader’s Teleport option, as recommended above; or
- Reset the password on the Worker Group - see Set Worker Passwords.
Add a Source
To minimize dependencies, this section walks you through enabling a Cribl Stream built-in Datagen Source to get some (fake) events flowing into your Workers. (This is the same approach used in our single-instance Getting Started Guide tutorial, but using a different datagen.)
If you prefer to configure Cribl Stream to receive events from a real data input that you’ve already set up, see our Sources topic for a link to the appropriate instructions.
- In the Leader’s sidebar, select Worker Groups.
- Select the Group name.
(Working with a free license, we’re implicitly configuring this Source on the
defaultGroup.) - On the Worker Groups submenu, select Data, then Sources.
- Select the Datagen tile. (You can use the search box.)
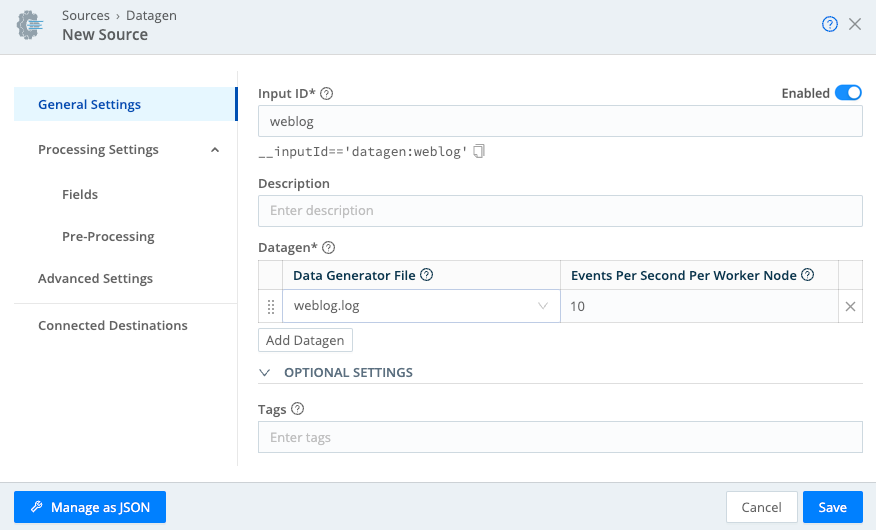
- Select Add Source to open a New Source modal.
- In the Input ID field, name this Source
weblog(or any unique name). - In the Data Generator File drop-down, select
weblog.log. This generates simulated log events for a website. - Keep the Events per Second per Worker Node at the default
10EPS for now. - Select Save. In the Enabled column, the toggle toggled on indicates that your Datagen Source has started generating sample data.
- Select Commit at the upper right, enter a commit message, and select Commit & Deploy.
This uses Cribl Stream’s
gitintegration to record thedefaultGroup’s new configuration and deploy it to your Workers.
If you’d like to verify that the Datagen is sending events, wait about a minute for them to start accumulating. Then, on the Datagen Sources page, select Live in the Status column for your configured Source. On the resulting Live Data tab, you should see events arrive within the default 10-second capture.
Add a Destination
On the output side, choose any of these options:
To configure a realistic output, but with no real dependencies and no license requirement, follow the Simulated Splunk Destination instructions just below.
For a simpler option, jump to the Internal Destination instructions further down.
To send data to a real receiver that you’ve already set up, see our Destinations topic for a link to the appropriate instructions.
Simulated Splunk Destination
Here, you’ll go through the steps of configuring a typical Splunk Destination, but you’ll use netcat to spoof the receiver on port 9997.
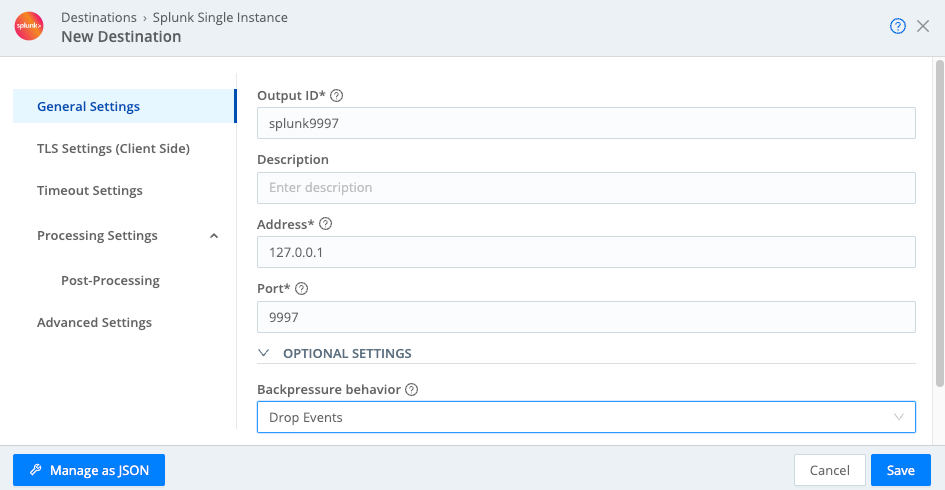
In the Cribl Stream Leader’s UI, configure a Splunk Single Instance Destination, following these instructions. For this simulated output:
- Set the Address to
127.0.0.1(that is, localhost). - Do not precede this IP address with any
http://orhttps:// - Leave the Port at the default
9997. - Set the Backpressure behavior to
Drop Events.
- Set the Address to
- In the Version Control menu at the upper right, select Commit, enter a commit message, and confirm the commit.
- Select Deploy to deploy this new configuration to your Workers.
- In the first Worker instance’s terminal/console, shell in, then enter
cd /opt/cribl/binto access Cribl Stream’s CLI. - Enter
nc -hto check whether netcat is installed on this Linux instance.
If the command fails, follow your Linux distro’s steps for installing netcat. (For example, for Ubuntu instructions, see Docker Notes below.)
- Enter
./cribl nc -l -p 9997to have netcat listen on port 9997, but simply discard data.
Docker Notes
If you’re using a container like Docker, before shelling in at step 4 above, you’ll need to first open a shell inside that container:
docker exec -it <CONTAINER ID> /bin/bashIn the above Docker Containers deployment example, you’d want to open the shell on the
docker_workers_1container, whose<CONTAINER ID>wasa3de9ea8f46f.Cribl’s Docker containers currently run Ubuntu 20.04.6. You can install netcat with this sequence of commands:
apt updateapt install netcat
The data you’ll now see displayed in the terminal will be gibberish, because of Splunk’s proprietary data format.
If data isn’t flowing, you might need to restart Workers. You can do this through Cribl Stream’s UI. With Docker containers, use docker compose down, followed by docker compose up.
You can streamline future Commit and Deploy steps by entering a Default commit message, and by collapsing actions to a combined Commit and Deploy button. Both options are available at Settings > Global > System > Git Settings > General.
Internal Destination
As an alternative to the Splunk instructions above, you can configure Cribl Stream’s built-in DevNull Destination to capture events and discard them. (This is the same Destination used in our single-instance Getting Started Guide tutorial.)
- In the sidebar, select Worker Groups.
- Select the Group name.
(Working with a free license, we’re implicitly configuring this Source on the
defaultGroup.) - On the Worker Groups submenu, select Data, then Destinations.
- Select the DevNull tile. (You can use the search box.)
- On the resulting devnull row, look for the Live indicator under Status. This confirms that the DevNull Destination is ready to accept events.
- In the Destinations list on the left, select the Default Destination at the top.
- Verify that Default Output ID points to the devnull Destination we just examined.
- Select Commit at the upper right, enter a commit message, and select Commit & Deploy.
Add a Pipeline
To complete this Distributed deployment with realistic infrastructure, let’s set up a Pipeline and Route.
If you’ve already done the Getting Started Guide, you’ve already created a slicendice Pipeline. In the following steps, skip ahead to adding an Eval Function.
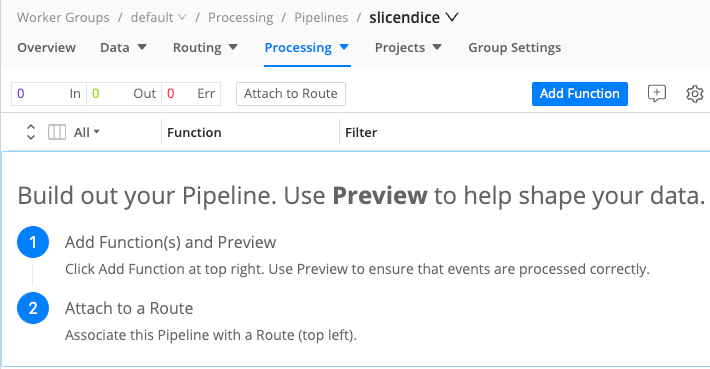
- From the Worker Group submenu, select Processing, then Pipelines.
- Select Add Pipeline, then Add Pipeline again.
- In the new Pipeline’s ID field, enter a unique identifier (for example,
slicendice). - Optionally, enter a Description of this Pipeline’s purpose.
- Select Save.
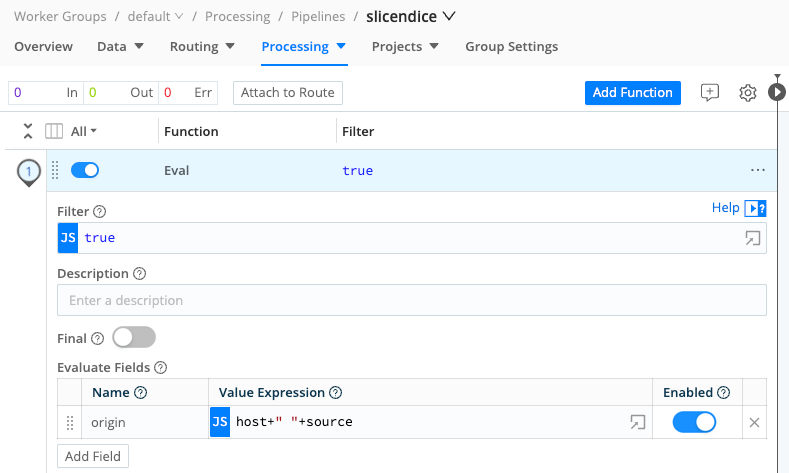
Add an Eval Function
Now add an Eval Function to the Pipeline:
At the top of the Pipelines page, select Add Function.
Search for the
EvalFunction, and select it.In the new Function’s Evaluate Fields section, select Add Field.
In the Name column, name the field
origin.In the Value Expression column, enter:
host+" "+sourceThis new
originfield will concatenate the host and source fields from incoming events.
- Select Save to store the Function’s configuration.
- Commit and Deploy the new Pipeline configuration.
- Optionally, open the right pane and select Capture Data to verify throughput.
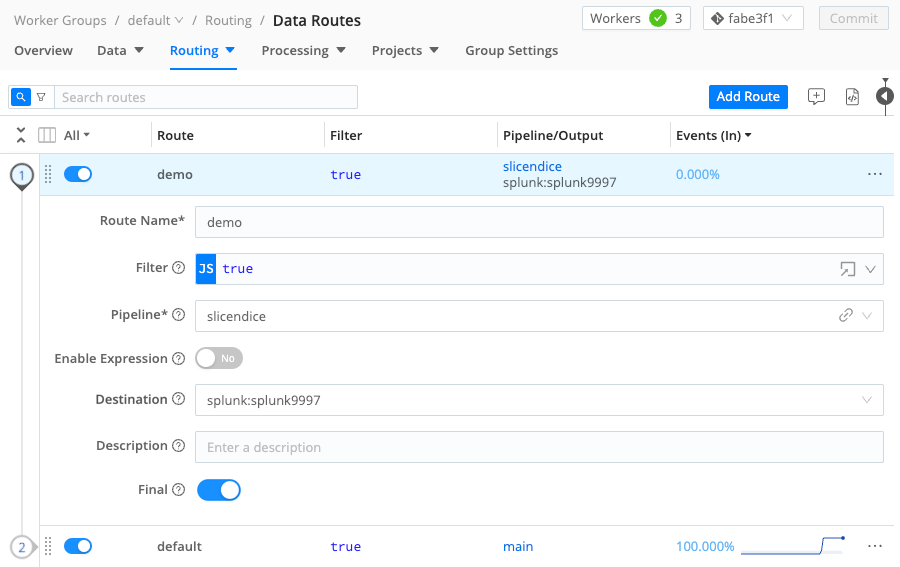
Add a Route
If you’ve already done the Getting Started Guide, you’ve already created a demo Route, attached to the slicendice Pipeline. In the following steps, just modify the Route to send data to the new Destination you configured above.
- At the top of the Pipelines page, select Attach to Route.
- Select Add Route.
- Enter a unique Route Name, like
demo. - Leave the Filter field set to its
truedefault, allowing it to deliver all events. - Set the Pipeline drop-down to our configured
slicendicePipeline. - Set the Destination drop-down to the Destination you configured above. If you boldly chose the Simulated Splunk Destination, this will be named something like
splunk:splunk9997. - You can leave the Description empty, and leave Final toggled on.
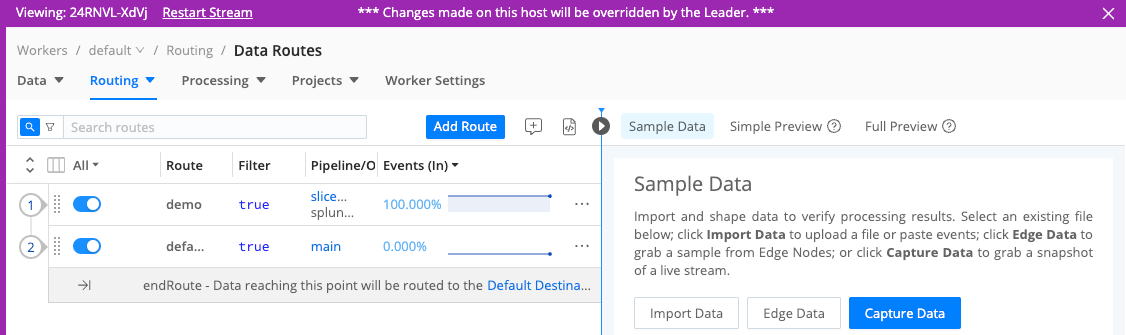
- Grab the new Route by its left handle, and drag it to the top of the Routing table, so that our new Route will process events first. You should see something like the screenshot below.
- Select Save to save the new Route configuration.
- Commit and Deploy your changes.
- Still assuming you configured a simulated Splunk output, look at the terminal where you’re running netcat. You should now see events arriving.
Managing Workers (Scaling)
With all our infrastructure in place, let’s look at how a Cribl Stream Distributed deployment scales up to balance the incoming event load among multiple Workers.
In the Leader’s sidebar, select Worker Groups.
Select the Group name. (Working with a free license, we’re implicitly configuring this Source on the
defaultGroup.)On the Worker Groups submenu, select Data, then Sources.
Find the Datagen Source you configured earlier and select it.
Change the Events per Second per Worker Node from the default
10EPS to a high number, like200EPS.Select Save, then Commit and Deploy this higher event load.
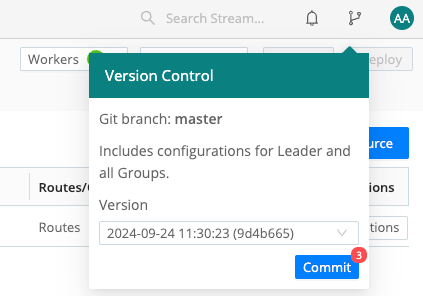
From the Version Control menu at the top tight, select Commit to commit the Leader’s newest config version. In the resulting modal, select Commit again to confirm.
This uses Cribl Stream’s
gitintegration to save a global configuration point for your whole deployment, which you can roll back to.
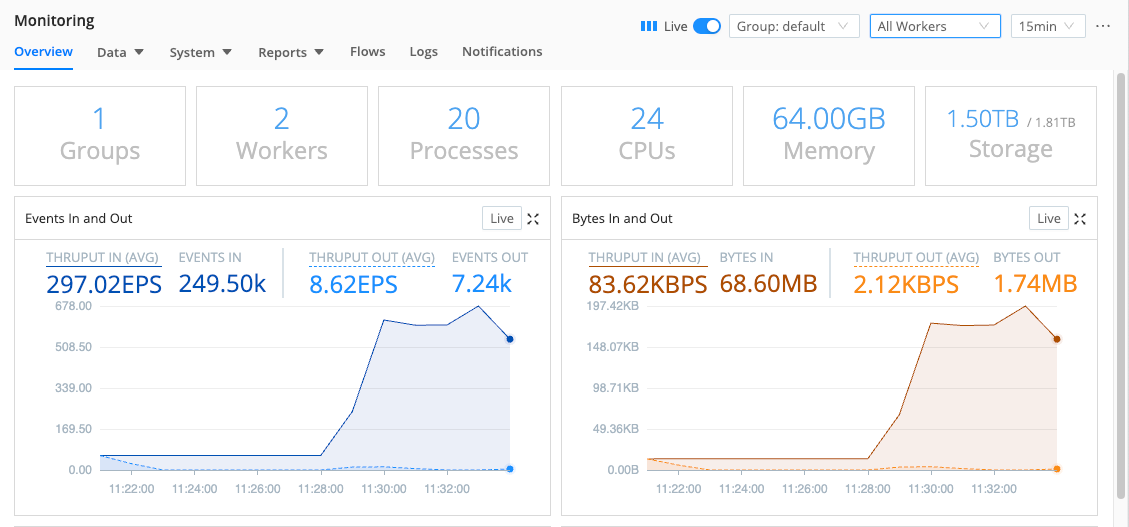
In the sidebar, select Monitoring.
Watch as the following changes unspool over the next few minutes:
- The CPU Load Average (1 min) will spike as the higher event volume floods the system.
- The Workers indicator at th top will drop to
0as the Workers restart with the new configuration you’ve deployed to them, and then rebound to2. - If you use the All Workers drop-down at upper right to toggle between your two individual Workers, you should see that Cribl Stream is balancing roughly equal event loads among them.
- To confirm that both Workers are
alive: In the sidebar, select Workers. - To wrap up, repeat this procedure’s first six steps to set the Datagen’s rate back down to
10EPS, and then save, commit, and deploy all changes.
What Have We Done?
This completes your setup of a basic Distributed deployment, using a free license, and configuring a single Worker Group of two identically configured Worker Processes. (You can extrapolate these same techniques you’ve just mastered to spin up virtually any number of Workers in the same way.)
To see how you can set up multiple Worker Groups - with separate configurations optimized for separate data flows - continue to the next section, noting its licensing prerequisites.
If you’re deferring or skipping that option, jump ahead to Cleaning Up.
Add and Manage Multiple Worker Groups (Optional)
To add and manage more than one Worker Group - everything in this optional section - you’ll need an Enterprise or Sales Trial license for your on-prem Cribl Stream deployment, or an Enterprise (or equivalent) plan for your Cribl.Cloud Organization. For details on adding multiple Worker Groups on Cribl.Cloud, see Cribl.Cloud Worker Groups.
See Licensing for how to acquire and install one of the above license types. Install the license on your Leader instance, and then commit this as a Leader config change (top nav’s Global Config dialog), before you proceed.
Here, we’ll build on the infrastructure we’ve created so far to:
- Configure Mapping Rules.
- Verify how Cribl Stream balances large data volumes among Worker Processes.
- Add a second Worker Group, data Source, and Destination.
- Add a second Pipeline and attach it to its own Route.
- Reconfigure Mapping Rules to send each Source’s data through a separate Group.
To keep this Quick Start tutorial focused on techniques, rather than on configuring lots of infrastructure, we’ll assign just one Worker to each Worker Group - one of the two Workers we launched above. But in production, you’ll be able to apply the same principles to setting up any number of Worker Groups, with any number of Workers.
Multiple-Group Setup
With an Enterprise or Sales Trial license/plan, Cribl Stream’s UI adds some extra features.
The Worker Groups page now supports multiple Groups. (For now, you still see only the single default Group - but we’ll change that a few sections down.)
On Cribl.Cloud, the Worker Groups page adds extra columns. You’ll see each Group’s Worker type (customer-managed / hybrid versus Cribl-managed / Cribl.Cloud) and, for Cloud Groups, the infrastructure provider (AWS or Azure), anticipated ingress rate and Provisioned status. For details, see Cribl.Cloud Worker Groups.
Note that if you’ve enabled Worker UI access, you can click directly through to each of your Workers. This feature will come in handy just below. To try it out:
- Either select Workers in the top right of the Worker Groups page, or select Workers in the sidebar.
- Select the desired Worker’s link in the GUID column.
- A purple header indicates that you’re viewing a Worker’s UI.
- To return to the Leader, select any option in the sidebar.
Check/Restart Workers
For the remaining steps, we want to make sure both our Workers (configured earlier) are up. Cribl Stream’s top header should indicate 2 WORKERS. You can verify that they’re alive by selecting Workers in the sidebar, as shown earlier. If so, proceed to Map Groups by Config.
If either or both Workers are down, restart them:
- Make sure you’ve enabled Worker UI access. (It’s time!)
- Click through to a dormant Worker’s UI.
- When you see that Worker’s UI (purple header), select Restart Stream.
- Confirm your choice, and wait for a confirmation message to appear for a few seconds.
- Return to the Leader’s UI.
- If the other Worker is down, repeat the above steps to restart it as well.
Map Groups by Config
With both Workers confirmed up, let’s look at how Cribl Stream has automatically mapped all these existing workers to the default Group.
In the sidebar, select Mappings.
You now see a default Mapping Ruleset, also literally named
default. Select it.A Cribl Stream Leader can have multiple Mapping Rulesets configured, but only one can be active at a time.
This
defaultRuleset contains one initial Rule, literally namedDefault Mappings. Expand its accordion as shown below.(The
defaultRuleset and Rule naming are separate from thedefaultGroup’s naming. All of these out-of-the-box starting configurations have been named…literally.)
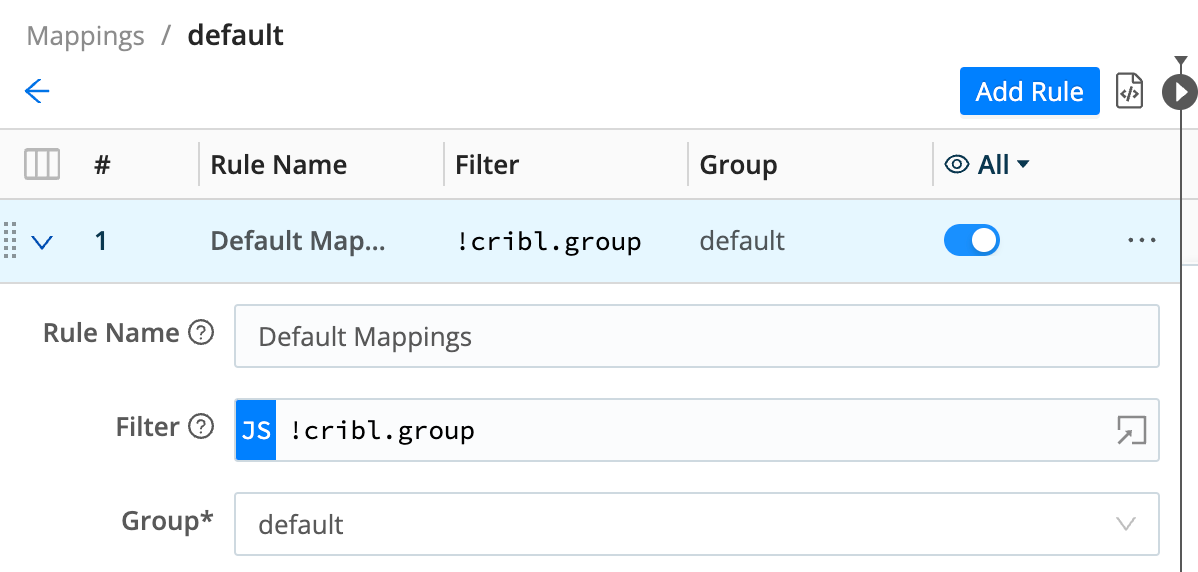
Below the Rule Name, a Mapping Rule has two functional fields:
- Filter:
!cribl.group- this value expression specifies “Not already assigned to a Worker Group.” - Group:
default- this value specifies “Assign to thedefaultGroup.”
So this is a catch-all rule. By following it, the Leader has assigned all (both) registered Workers to the default Group.
Let’s make a more-specific rule, mapping a specific Worker (by hostname) to this Group, which receives events from our weblog Datagen Source.
Add Mapping Rules
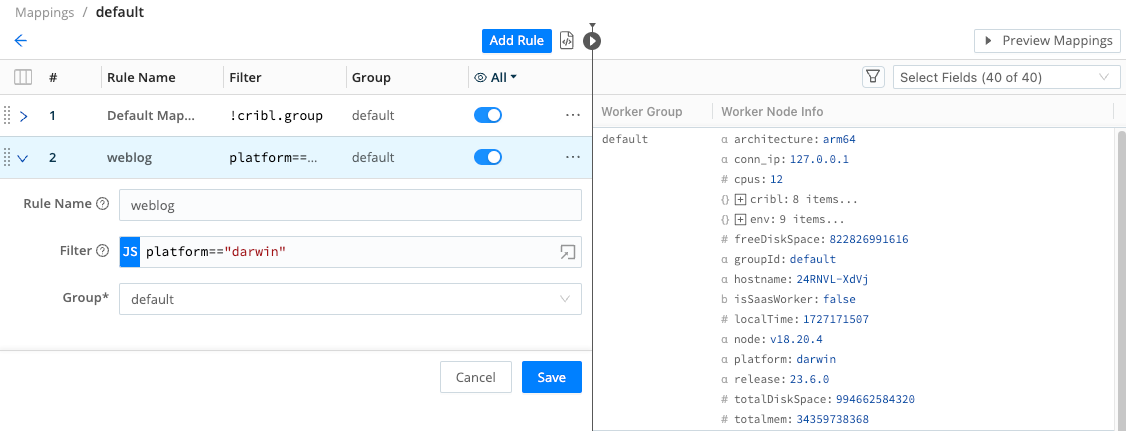
Select Add Rule. Then configure the new Rule as shown below:
- Rule Name:
weblog- for simplicity. - Filter:
platform=="<this-worker's-platform>"- get this value from the right Preview pane. Look for theplatformfield’s value. In the example shown below, we got"darwin". - Group:
default- this is the only option available.
- Rule Name:
- Select Save to add this Rule.
- Confirm the warning that changes will take effect immediately.
- From the Version Control menu, select Commit to commit the Leader’s new config.
For more Mapping Rules/Rulesets details and examples, see Distributed Deployment.
Next, we’ll add a second Worker Group; add a second Source (relaying Cribl Stream’s internal metrics); and then add another Mapping Rule, to map our second Worker to the new Group.
Add Another Worker Group
- In the Leaders’ sidebar, select Worker Groups.
- Select Add Group.
- Name the new Group
CriblMetricsto match its purpose. - Select Enable teleporting to Workers.
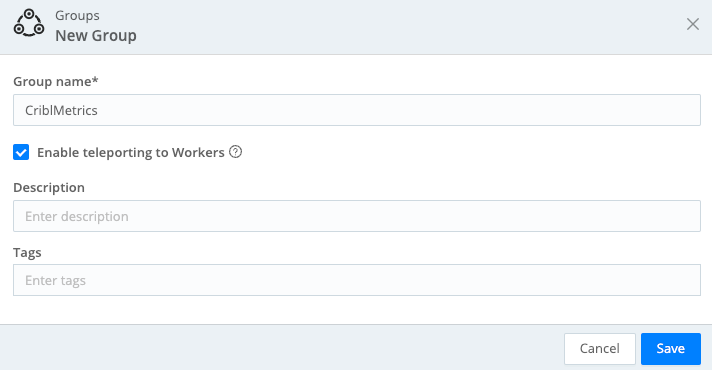
- Save the Group.
- Select Deploy on the new Group’s row, and confirm your choice. The new Group should deploy immediately.
- From the Version Control menu, select Commit to commit the new config on the Leader.
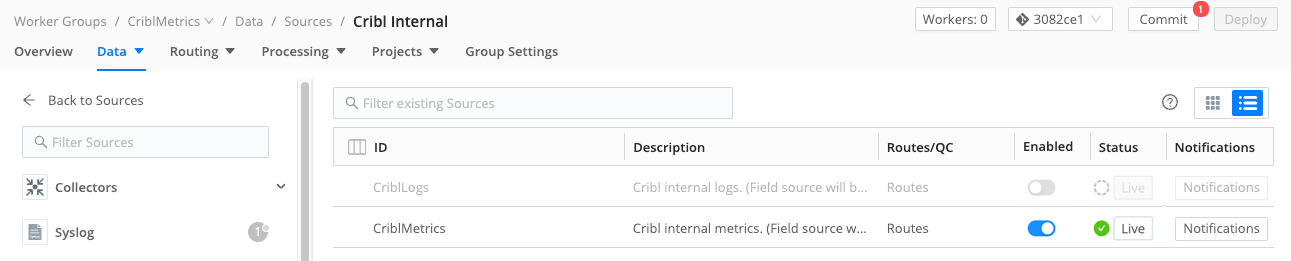
Add Another Source
On the new Group, we’ll now enable a Cribl Internal: Metrics Source, representing a second data type.
- In the sidebar, select Worker Groups , and then select the new
CriblMetricsGroup. - On the Worker Groups submenu, select Data, then Sources.
- Select the Cribl Internal tile.
- Enable the
CriblMetricsSource and confirm.
- Select Commit to commit the new config on the Leader and Group.
- From the Version Control menu, select Commit to deploy this new configuration to your Workers.
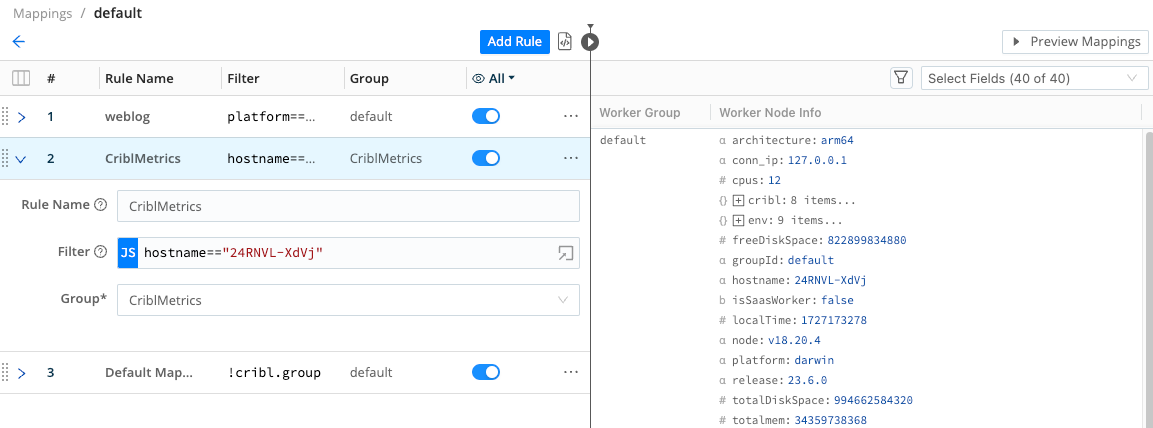
Map Workers to Groups
Now let’s map this new group to the CriblMetrics Source’s incoming events:
In the sidebar, select Mappings.
Select the
defaultMapping Ruleset to open it.Select Add Rule. Then configure the new Rule as shown below:
- Rule Name:
CriblMetrics- for simplicity. - Filter:
hostname=="<this-worker's-hostname>"- get this value from the right Preview pane. In the second Worker down, look for thehostnamefield’s value. In the example shown below, we got"2ca68fec7de0". - Group:
CriblMetrics- this is the Group we want to map.
- Rule Name:
Move the
Default Mappingsrule to the bottom of the Ruleset, reflecting its catch-all function.Select Save to store the new configuration.
Confirm the warning that changes will take effect immediately.
- From the Version Control menu, select Commit to commit the Leader’s new config.
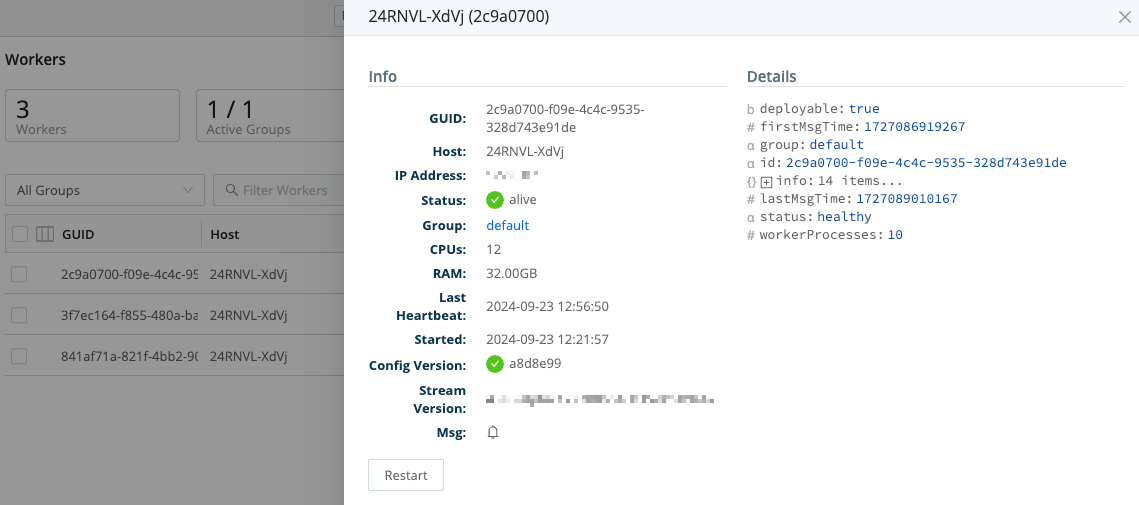
We now have two data Sources and two Worker Groups - one each for (Web) logs versus (Cribl Internal) metrics - along with two Mapping Rules to map data accordingly. To confirm the Workers’ assignment to the two Groups, select Workers in the sidebar.
To confirm further details about the Workers, in the sidebar, select Workers, and on the resulting Workers page, click anywhere on the Worker Node’s row to reveal more details:
Configure Metrics Output
With incoming metrics now mapped to our second Worker Group, we next need to configure this Group’s output. Here, we’ll rely on a metrics-oriented Pipeline and a Destination that ship with Cribl Stream, and create a new Route to connect everything up.
Examine the Metrics Pipeline
- In the sidebar, select Worker Groups , and then select the
CriblMetricsGroup. - On the Worker Groups submenu, select Processing, then Pipelines.
- Find the
cribl_metrics_rollupPipeline, and click it to expand it. - Expand this Pipeline’s Functions (including Comments) to see its configuration. It’s preconfigured with a Rollup Metrics Function to aggregate metrics to a 30-second time window. Next is an Eval Function that filters for Cribl (Cribl Stream) internal metrics and tags them on outgoing events with a new field.
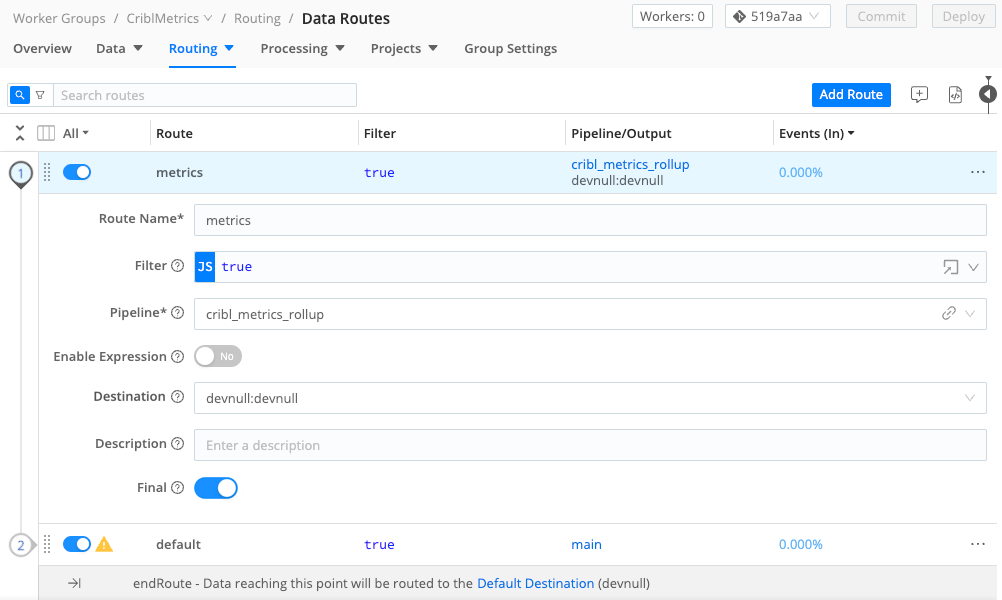
Add Another Route
We’ll connect this existing Pipeline to a new Route:
At the top of the
cribl_metrics_rollupPipeline page, select Attach to Route.Select Add Route.
Enter a unique Route Name, like
metrics.Leave the Filter field set to its
truedefault, allowing it to deliver all events.Make sure the Pipeline drop-down is set to
cribl_metrics_rollup.As the Destination, select our old friend
devnull:devnull.This is Cribl Stream’s preconfigured Destination that simulates a downstream service while simply dropping events.
You can leave the Description empty, and leave Final toggled on.
Grab the new Route by its handle, and drag it to the top of the Routing table, so that our new Route will process events first. You should see something like the screenshot below.
Select Save to save the new Route configuration.
Commit and Deploy your changes.
Verify the Multi-Group Deployment
From the sparkline on the Route you just configured, you can already see that metrics data is flowing all the way “out” of Cribl Stream - simulated here by the DevNull Destination.
To verify the whole configuration you’ve created, in the sidebar, select Monitoring. On the Monitoring page, use the All Worker Groups drop-down (upper right) to toggle between the two Worker Groups to see the division of labor:
- Group
default(the out-of-the-box Group we configured first) handles theweblog.logdata. - Group
CriblMetricshandles the metrics data.
All the Distributed Things - Review
Before a final section where you can tear down your infrastructure, here’s a recap of the simple (but expandable) distributed model we’ve created, with some ideas for expanding it:
A Distributed deployment enables Cribl Stream to scale out to higher data volumes. This load-balancing occurs even with a single Worker Group, in which all Workers share the same configuration.
By adding multiple Worker Groups, you can partition Worker Nodes (and their data flows) by different configurations. In this demonstration, we simply mapped Workers to Groups by the Workers’
hostname. But you can map by a range of arbitrary criteria to meet your production needs.For example: Different Groups can be managed by different teams. You can filter on DNS rules to send relevant data to the relevant team’s Group.
Different Groups can also maintain configurations for different regions’ data privacy or data retention requirements.
You can also Map workers arbitrarily using Tags and other options.
More About Worker Groups, Nodes, and Processes - Definitions
Cribl Stream refers to “Workers” at several levels. Now that you’ve been initiated into building distributed deployments, here’s a guide to the fine points of distinguishing these levels:
A Worker Group holds one or multiple Worker Nodes.
Each Worker Node functions like an independent Cribl Stream Single-instance deployment. Worker Nodes don’t coordinate directly with each other - they’re coordinated only through communication to/from the Leader Node.
Each Worker Node contains a configured number of Worker Processes. Unlike the above grouping abstractions, this is the level that actually processes data. To load-balance among Worker Processes, Cribl Stream’s API Process round-robins incoming connections to them.
When deploying on AWS/EKS, Worker Groups should not span Availability Zones. If you have EBS persistent volumes, and a node fails, its replacement won’t be able to access the peer volume across AZs.
Clean Up
If and when you choose to shut down the infrastructure you’ve configured for this demonstration:
Navigate to Cribl Stream’s
defaultGroup > Data > Sources > Datagen, and disable the toggle besideweblog.log.If you configured a second Worker Group: Navigate to Cribl Stream’s
CriblMetricsWorker Group > Data > Sources > Cribl Internal, and disable the toggle beside CriblMetrics.If you have
netcatrunning on a Worker’s terminal/console,^Cit.There’s no need (or way) to switch off the DevNull Destination - it just is.
If desired, Commit and Deploy these changes.
If you’re running the Cribl Stream server(s) on cloud instances that will (ultimately) incur charges, you’re now free to shut down those cloud resources.
Next Steps
Interested in guided walk-throughs of more-advanced Cribl Stream features? We suggest that you next check out these further resources.
Distributed Deployment: All the details behind the deployment approach you just mastered in this tutorial.
Cribl Stream Sandbox: Work through general and specific scenarios in a free, hosted environment, with terminal access and real data inputs and outputs.
Use Cases documentation: Bring your own services to build solutions to specific challenges.
Cribl Concept: Pipelines - Video showing how to build and use Pipelines at multiple Cribl Stream stages.
Cribl Concept: Routing - Video about using Routes to send different data through different paths.