


Cribl Internal Source
The Cribl Internal Source enables you to capture and send Cribl Stream’s own internal logs and metrics through Routes and Pipelines.
Type: Internal | TLS Support: N/A | Event Breaker Support: No
You can’t configure custom Cribl Internal Sources.
Scope and Purpose
In Distributed mode, this Source’s CriblLogs option can process internal logs only from Worker Processes. (Logs on the Leader remain on the Leader, because the Leader Node is not part of any processing path.)
In both Distributed and Single-instance mode, this Source’s CriblLogs option omits API Process logs, meaning that it omits telemetry/license-validation traffic. You can, however, use a Script Collector to check for API Server (or Worker Group) events.
This Source’s CriblMetrics option offers Cribl’s most up-to-date and precise view of event throughput and transformation, aggregated every 2 seconds at the Worker Process level. The CriblLogs option is less granular - tracking logs that are written once per minute - so CriblLogs might fail to reflect Worker Process crashes or restarts.
In Cribl.Cloud, on Cribl-managed Worker Groups in Cribl.Cloud, the CriblLogs internal Source contains only logs related to Sources and Destinations.
Configure Cribl Internal Logs/Metrics as a Data Source
On the top bar, select Products, and then select Cribl Stream. Under Worker Groups, select a Worker Group. Next, you have two options:
- To configure via QuickConnect, navigate to Routing > QuickConnect (Stream) or Collect (Edge). Select Add Source and select the Source you want from the list, then choose Select Existing.
- To configure via the Routes, select Data > Sources (Stream) or More > Sources (Edge). Select the Source you want.
Next, select either the default
CriblLogsorCriblMetricsto open the configuration modal.Configure the General Settings for your selected Source.
- For Cribl Logs, configure the following:
- Enabled: This duplicates the parent page’s Enabled toggle. Toggle on to enable Cribl logs as a Source.
- Input ID: This is prefilled with the default value
CriblLogs, which cannot be changed. - Description: Optionally, enter a description.
- For Cribl Metrics, configure the following:
- Enabled: This duplicates the parent page’s Enabled toggle. Toggle on to enable Cribl metrics as a Source.
- Input ID: This is prefilled with the default value
CriblMetrics, which cannot be changed. - Description: Optionally, enter a description.
- For Cribl Logs, configure the following:
Next, you can configure the following Optional Settings for your selected Source:
For Cribl Logs, configure the following:
- Tags: Optionally, add tags that you can use to filter and group Sources in Cribl Stream’s UI. These tags aren’t added to processed events. Use a tab or hard return between (arbitrary) tag names.
For Cribl Metrics, configure the following:
- Metric name prefix: Enter an optional prefix that will be applied to metrics provided by Cribl Stream. The prefix defaults to
cribl.logstream. - Full fidelity: Toggle off to reduce CPU load by excluding metrics for any fields listed in Settings > Global > System > General Settings > Limits > Metrics > Disable field metrics. See Controlling Metrics Volume for details. By default, these include:
cribl.logstream.host.(in_bytes,in_events,out_bytes,out_events)cribl.logstream.index.(in_bytes,in_events,out_bytes,out_events)cribl.logstream.project.(in_bytes, in_events, out_bytes, out_events)cribl.logstream.source.(in_bytes,in_events,out_bytes,out_events)cribl.logstream.sourcetype.(in_bytes,in_events,out_bytes,out_events)
- Metric name prefix: Enter an optional prefix that will be applied to metrics provided by Cribl Stream. The prefix defaults to
Tags: Optionally, add tags that you can use to filter and group Sources in Cribl Stream’s UI. These tags aren’t added to processed events. Use a tab or hard return between (arbitrary) tag names.
Optionally, configure any Processing and Advanced settings outlined in the sections below.
Select Save, then Commit & Deploy.
Processing Settings
Fields
In this section, you can define new fields or modify existing ones using JavaScript expressions, similar to the Eval function.
- The Field Name can either be a new field (unique within the event) or an existing field name to modify its value.
- The Value is a JavaScript expression (enclosed in quotes or backticks) to compute the field’s value (can be a constant). Select this field’s advanced mode icon (far right) if you’d like to open a modal where you can work with sample data and iterate on results.
This flexibility means you can:
- Add new fields to enrich the event.
- Modify existing fields by overwriting their values.
- Compute logic or transformations using JavaScript expressions.
Pre-Processing
In this section’s Pipeline drop-down list, you can select a single existing Pipeline or Pack to process data from this input before the data is sent through the Routes.
Advanced Settings
Environment: If you’re using GitOps, optionally use this field to specify a single Git branch on which to enable this configuration. If empty, the config will be enabled everywhere.
Connected Destinations
Select Send to Routes to enable conditional routing, filtering, and cloning of this Source’s data via the Routing table.
Select QuickConnect to send this Source’s data to one or more Destinations via independent, direct connections.
Reporting Metrics Less Frequently
By default, Cribl Stream generates internal metrics every 2 seconds. To consume metrics at longer intervals, you can use or adapt the cribl_metrics_rollup Pipeline that ships with Cribl Stream.
Attach this Pipeline to your Cribl Internal Source as a pre-processing Pipeline. The Pipeline’s Rollup Metrics Function has a default Time Window of 30 seconds, which you can adjust to a different granularity as needed. This provides a second lever to reduce granularity, in addition to the Full fidelity toggle described above.
Omitting sourcetype
You can easily drop the sourcetype attribute from metrics events, leaving only event_sourcetype. This will prevent duplicate sourcetype events from being routed to Destinations.
To do this: In the same cribl_metrics_rollup pre-processing Pipeline (or a clone) that you attach to your Source, enable the final Eval Function, which applies this Filter expression to remove the sourcetype field:
_metric && _metric.startsWith('cribl.logstream.sourcetype.')
Duplicated Fields/Dimensions
The CriblMetrics Source operates on metrics that Worker Nodes report to their Leader Nodes. Typically included are source and host fields.
Sending metrics from this Source to Splunk is one common use case. Because Splunk might overwrite these two fields, the Source copies their values into new dimensions with added event_ prefixes: event_source and event_host. This way, if Splunk does overwrite source and/or host, their original values remain intact in the new dimensions with event_ prefixes.
Here’s an example of how the added dimensions look in the Live Capture window:
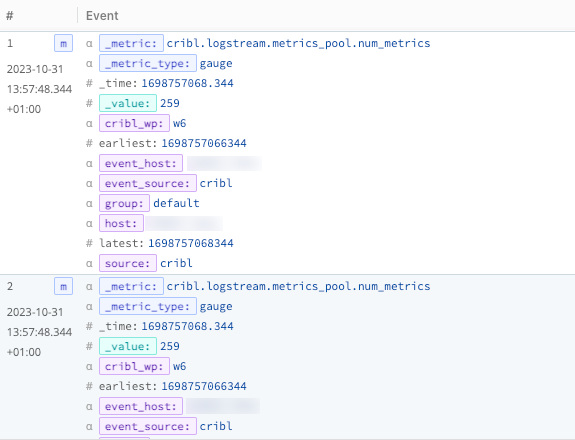
If you are not sending to a downstream service that overwrites source or host fields, you can use an appropriate Function to drop the added dimensions. You also have the option to suppress these fields entirely by specifying them in Settings > Global > System > General Settings > Limits > Metrics > Disable field metrics.
Internal Fields
The following fields will be added to all events/metrics:
source: set tocribl.host: set to the hostname of the Cribl instance.
Use these fields to guide these events/metrics through Cribl Routes.
All Cribl internal fields are subject to change and modification. Cribl provides them to assist with analytics and diagnostics, but does not guarantee that they will remain available.