


File Monitor Source
The File Monitor Source generates events from text files, compressed, archived, and (some) binary log files, based on lines and records extracted from the content.
Type: System | TLS Support: N/A | Event Breaker Support: Yes
This Source is available in Cribl.Cloud on customer-managed hybrid Workers, but not on Cribl-managed Workers in Cribl.Cloud.
As of v.4.2.x, this Source can process the following file formats:
- Compressed/archived:
zip,gzip,zstd, andtar. Cribl Stream only supports DEFLATE compression forzipfiles. - UTF-8:
text. - Non-identifiable binary: Includes all file formats that aren’t in the Cribl Edge-supported compressed, archived, and text categories.
Binary files are broken into base64-encoded chunks and streamed bypassing Event Breakers. Text files are processed normally through Event Breakers. (Before v.4.2.x, the File Monitor Source could handle only text files.) Also as of v.4.2.x, the File Monitor Source no longer excludes *.gz files by default.
File Monitoring and One-Time Ingestion
Cribl Edge offers two options for ingesting file data:
- File Monitor Source: This is ideal for ongoing log file monitoring. By default it will prioritize processing the latest data in newly discovered files upon startup (“Collect from end”). Subsequently, it automatically monitors and ingests new content as it’s added.
To automatically discover and ingest new log files, Cribl Edge requires privileged access for file scanning and reading. For alternative approaches, see Running Edge as an Unprivileged User.
- One-time File Ingest: This feature complements the File Monitor by allowing a one-time ingest of any file. It’s useful for quickly processing specific files or initial data loads. If Explore is enabled, as it might be restricted in some environments for security reasons.
Discovering and Filtering Files to Monitor
To produce its initial list of files to monitor, the File Monitor Source runs a discovery procedure at a configurable Polling interval. The Source then applies a Filename allowlist to filter the initial list down into its final form. Then, for each file on the list, the Source compares current state with previously-stored state. This comparison determines whether the File Monitor Source will actually watch a given file for a given polling interval, or just ignore the file.
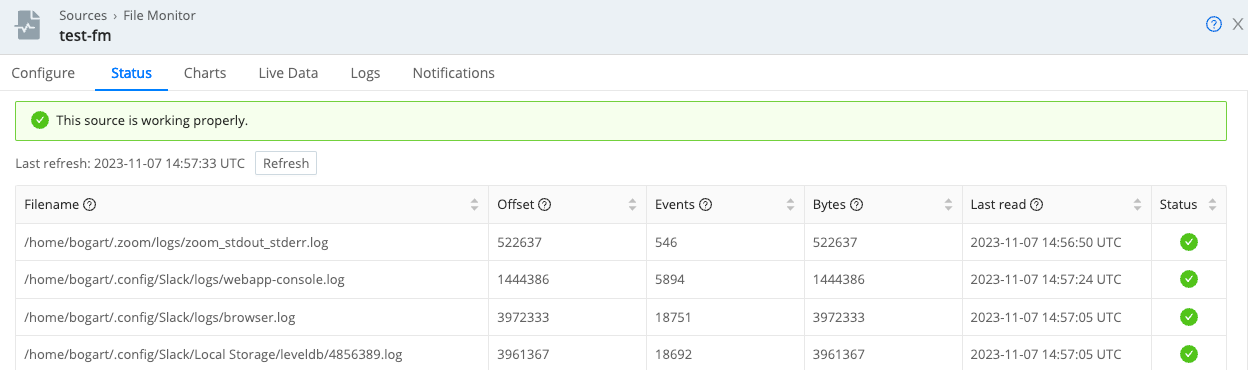
In the simplest case, the Source discovers a file for which it has no stored state. This means that the file has just been created, and needs to be monitored. See the Examples for other possibilities, along with a description of the Status tab, which displays state information for all files being monitored.
How does the File Monitor Source discover files in the first place? You have the choice of two Discovery Modes: Auto or Manual.
In Auto mode, the Source automatically discovers files that running processes have open for writing. Auto mode collects logs from the discovered active files that match the allowlist.
Auto mode is useful to detect which files are being written to. For example, if you enter an allowlist of
*log, Auto mode will find all the active logs within that directory, no matter what’s writing to it, and it will exclude any rotated logs.
Cribl Edge currently supports Auto mode only when running on Linux, not on Windows or macOS. Windows and macOS deployments require using the Manual option. For a Windows-specific configuration, see Collect Logs with File Monitor.
In Manual mode, the Source discovers files based on the specified directory and depth.
Manual mode is often used to collect logs in a folder where the process that creates them rotates them when they get large. For example, if you specify a path of
/var/logand an allowlist of*/messages*, Manual mode will capture the current/var/log/messages, as well as older logs from/var/log/messages*.Manual is the default discovery mode for new File Monitor Sources.
If you are using a tool like
rsyncto transfer files in chunks, the File Monitor Source might start collecting files before the transfer is complete. To prevent this, configure your tool to transfer files serially. (For example, use:rsync --append.)
Configure a File Monitor Source
- On the top bar, select Products, and then select Cribl Stream. Under Worker Groups, select a Worker Group. Next, you have two options:
- To configure via QuickConnect, navigate to Routing > QuickConnect (Stream) or Collect (Edge). Select Add Source and select the Source you want from the list, choosing either Select Existing or Add New.
- To configure via the Routes, select Data > Sources (Stream) or More > Sources (Edge). Select the Source you want. Next, select Add Source.
- In the New Source modal, configure the following under General Settings:
- Enabled: Toggle on to enable the Source.
- Input ID: Enter a unique name to identify this File Monitor Source definition. If you clone this Source, Cribl Stream will add
-CLONEto the original Input ID. - Description: Optionally, enter a description.
- Discovery Mode: Select either Auto or Manual. See Discovering and Filtering Files to Monitor for details on how each mode works.
- Auto: Tells the Source to automatically discover files that running processes have open for writing.
- Manual: Tells the Source to discover files within a single directory that you specify as the Search path, down to the Max depth.
- Search path: Enter an absolute path (no wildcards). Defaults to the
/var/logdirectory. - Max depth: Controls how many levels deep the Source will search within the Search path.
If you leave the Max depth field empty, the Source will search subdirectories, and their subdirectories, and so on, without limit. If you specify
0, the Source will discover only the top-level files within the Search path. For1, the Source will discover files one level down. - Suppress errors when search path does not exist: Toggle on to hide
Path does not existerrors when a directory doesn’t exist. When enabled, missing directories will not affect the File Monitor Source health status. This is useful when you know the search path contains nonexistent directories for some hosts, and you don’t want to see the error messages in the File Monitor status and logs. - Delete files: Whether to delete the source file after it has been idle for the specified Idle timeout period. This toggle is under Advanced Settings.
- Search path: Enter an absolute path (no wildcards). Defaults to the
- Next, you can configure the following Optional Settings:
- Polling interval: Interval of time in seconds to run the discovery procedure. Defaults to
10seconds. - Filename allowlist: Controls which files the Source discovers and monitors. Defaults to
*/log/*and*log. You can use wildcards (*) to match any sequence of characters and the exclamation mark (!) for negation. These patterns are matched against the full path of the file. For example:- Wildcard (
*):*DhcpSrvLog-*.logcollects file/var/log/DhcpSrvLog-05-22-2025.log. - Negation
!:!*cribl*access.logprevents the Source from discovering Cribl Stream’s own log files.
If you’re using Manual discovery mode, always think through how your Search path and Filename allowlist settings interact. If you’re not careful, you can inadvertently create overlapping monitor groups that deliver duplicates of some files. See Using Allowlists Effectively for details.
- Wildcard (
- Apply filename allowlist internal to archive files: Toggle on if you want the filename allowlist to apply to files inside archives such as
tarorzip. - Minimum age duration: Optionally, specify a minimum age of files to monitor. This Source will only start ingesting a file once its modification time exceeds the configured duration. Enter a duration in a format like 30s, 15m, 1h. Defaults to an empty field, which applies no age filters.
- Maximum age duration: Optionally, specify a maximum age of files to monitor. This Source will filter events with timestamps newer than the configured duration. (Where files don’t have a parsable timestamp, it will set their events’ timestamp to
Now.) Enter a duration in a format like30s,4h,3d, or1w. Defaults to an empty field, which applies no age filters. - Check file modification times: Toggle on if you want this Source to skip files with modification times older than the configured Maximum age duration. When you set an Maximum age duration threshold, the Source will open every file and read through all its contents to seek a timestamp. For best performance, also toggle Check file modification times on skip older files.
- Collect from end: When toggled on (default) this Source prioritizes processing the latest data by jumping to the end of newly discovered files on Cribl Stream’s startup. This allows focusing on new content in existing log files. However, this behavior only applies during the first encounter with a file. For existing files after the initial scan and all subsequent discoveries, Cribl Stream will switch to reading from the beginning to capture ongoing updates.
- Enable binary files: Toggle on if you want this Source to report the file as binary and stream it in Base64-encoded chunks. By default, the Source ignores binary (non-text) files such as JPEG images, MP3 audio files, or some binary data files.
- Force text format: Toggle on if you want this Source to display ingested data as text in the event (when the data isn’t in a compressed or archived file). This option is helpful if you have files that contain binary mixed with text where the data should be streamed as all text (for example, AuditD logs can contain this type of data).
- Tags: Optionally, add tags that you can use to filter and group Sources in Cribl Stream’s UI. These tags aren’t added to processed events. Use a tab or hard return between (arbitrary) tag names.
- Polling interval: Interval of time in seconds to run the discovery procedure. Defaults to
- Optionally, you can adjust the Processing and Advanced settings, or Connected Destinations outlined in the sections below.
- Select Save, then Commit & Deploy.
Processing Settings
Event Breakers
Event Breaker rulesets: A list of event breaking rulesets that will be applied to the input data stream before the data is sent through the Routes. Defaults to System Default Rule.
Event Breaker buffer timeout: How long (in milliseconds) the Event Breaker will wait for new data to be sent to a specific channel, before flushing out the data stream, as-is, to the Routes. Minimum 10 ms, default 10000 (10 sec.), maximum 43200000 (12 hours).
Fields
In this section, you can define new fields or modify existing ones using JavaScript expressions, similar to the Eval function.
- The Field Name can either be a new field (unique within the event) or an existing field name to modify its value.
- The Value is a JavaScript expression (enclosed in quotes or backticks) to compute the field’s value (can be a constant). Select this field’s advanced mode icon (far right) if you’d like to open a modal where you can work with sample data and iterate on results.
This flexibility means you can:
- Add new fields to enrich the event.
- Modify existing fields by overwriting their values.
- Compute logic or transformations using JavaScript expressions.
Pre-Processing
In this section’s Pipeline drop-down list, you can select a single existing Pipeline or Pack to process data from this input before the data is sent through the Routes.
Advanced Settings
Idle timeout: Time, in seconds, before an idle file is closed. Defaults to 300 sec. (5 minutes).
Hash length: How many file header bytes to use in a hash for identifying a file uniquely. Defaults to 256 bytes. For details, see Configuring Hash Lengths.
Delete files: Default is toggled off. When toggled on: Cribl Stream will delete the source file after it has been idle for the specified Idle timeout period. This setting is only available in Manual mode. In the confirmation modal, select Enable to proceed. Files that fail to delete will be reported as errors on the Status tab for up to one hour.
Files might not be deleted if:
- The Cribl Service doesn’t have proper permissions to access and delete the files.
- They are currently in use by other applications on Windows.
- They are being moved or renamed while Cribl Stream is collecting them.
- Their filenames are not on the allowlist.
To make sure files are deleted properly:
- Verify and grant necessary permissions to the Cribl Service. For details, see Configure Cribl Stream for Non-Root User and Running Edge as an Unprivileged User.
- Consider access patterns and how files are being used.
- Adjust system settings if necessary (such as, file sharing, antivirus exclusions).
Salt file hash: Default is toggled off. Toggle on to salt the hash with the source file name. Use this option for files with the same header (for example, CSV files) to ensure that each has a different hash and can be ingested correctly. A file will get a new hash and be re-ingested if you move or rename it. Additionally, toggling this setting on after the Source has started operating will cause all files to be re-ingested as well.
Environment: If you’re using GitOps, optionally use this field to specify a single Git branch on which to enable this configuration. If empty, the config will be enabled everywhere.
Connected Destinations
Select Send to Routes to enable conditional routing, filtering, and cloning of this Source’s data via the Routing table.
Select QuickConnect to send this Source’s data to one or more Destinations via independent, direct connections.
This Source defaults to QuickConnect.
Internal Fields
Cribl Stream uses a set of internal fields to assist in handling of data. These “meta” fields are not part of an event, but they are accessible, and Functions can use them to make processing decisions.
For the File Monitor Source, you can use internal fields to enrich events with container and host metadata. The following internal fields are available:
__baseFilename__source/source__raw__inputIdcontainer_idcontainer_pathhost_path__unresolved_source(This internal field represents the unresolved path for the symbolic link configured in the File Monitor Source.)
Monitoring Renamed Files’ State
The File Monitor Source uses a simple scheme to find “backlog” files corresponding to a matching file: Tell it to tail foo.log, and it will look for foo.log.[0-9] and scrape those, too.
This Source keeps hashes that correspond to the start point within the file, and to the last-read point. This way, if Cribl Stream is stopped, files are rotated, and Cribl Stream is restarted, the File Monitor Source can find the resume point in those backlog files.
Similarly, if you rename the file within the same backlog scheme (for example, foo.log to foo.log.0), the File Monitor Source can resume at the right place. However, if you renamed foo.log to bar.log (a deviation from the expected naming scheme), this Source could not find its resume point.
File Tracking with Hashes
The File Monitor Source doesn’t track state using filenames. Instead, it uses hashes of the head and tail of the file to identify it later so it can resume where it left off.
To make sure hashes are generated correctly to ingest the files you want, follow these better practices.
Configure Hash Lengths
For files with identical first lines, configure the hash length to be longer than the first line to ensure that the header includes something unique. It is common for a batch of CSV files or IIS logs to have identical first lines listing columns that appear in subsequent lines.
If you don’t adjust the hash length, all files with headers larger than 256 bytes will appear to File Monitor as one file. As long as the hash length is greater than the header length, and the subsequent lines include something unique, the File Monitor Source will identify them as different files.
Salt the Hashes
If you want to ingest files with identical first lines (such as CSV files), and configuring hash length does not yield satisfying results, you can ensure different hashes for the files by toggling the Salt file hash setting. See Salt file hash for more details.
Avoid Race Conditions
The hashing logic isn’t instantaneous, so it’s possible for files with the same header and the same hash to be both collected.
For example, quickly copying the same example file to separate eg1.log and eg2.log files in the Source’s path
will usually result in both files being collected even though they share the same hash.
However, copying it to eg3.log shortly (not immediately) after
will result in that third file being ignored because its hash matches an existing entry in the state-store.
Don’t Ingest Multiple Copies of the Same File
Creating copies of the same file in the Source’s path will not result in the file being ingested multiple times. The head-hashing logic used by the Source to determine what it’s seen before and how far it’s collected already prevents you from successfully testing multiple copies of the same.
Don’t Point Multiple File Monitor Sources at the Same File
Multiple File Monitor Sources set to collect the same file will result in duplicate events. Sources run independently and don’t coordinate with each other.
Using Allowlists Effectively
Done properly, file monitoring collects exactly the files you need to see, without duplication. You want to avoid inadvertently creating overlapping monitor groups that deliver duplicates, because this can “run the meter” twice for affected files, potentially causing issues with data ingestion volume limits.
The key is knowing how to craft allowlists.
Crafting Allowlists: Principles
To get the results you want from file monitoring, always apply the following principles.
Write allowlists to explicitly include the full path of files you want to collect.
The search path itself is not excluded from the match. For example, if you want to collect the file /var/log/messages when you’ve set your search path to /var/log, your filename allowlist needs to be either /var/log/messages, /var/*/messages, or */log/messages.
Exclusions (!) also need to address the full file path. For example, if you want to collect everything from /var/log/* except for /var/log/apache/*, your allowlist must include one of the following:
!/var/log/apache/*!*/apache/*!*/log/apache/*
Wildcards (*) match any part of the file path:
*logmatches/var/foo/bar/myfile.log.*.logmatches anything ending in.log./var/log/*matches anything in/var/log, subject to the Max Depth setting.
Put explicit matches (and exclusions) at the beginning of the allowlist, ahead of wildcard matches.
For example, an allowlist of /var/log/* followed by !/var/log/apache/* will fail to exclude the file /var/log/apache/foo because that file matches the first allowlist entry.
In allowlists, order matters!
Be as specific as possible, whenever possible, to prevent accidental matches.
Each of the following examples shows how to avoid matching unwanted files within the directories that you’re monitoring.
To collect /var/log/boot.log (and older versions of boot.log.*) as well as /var/log/messages:
| Search path | Filename allowlist |
|---|---|
/var/log | /var/log/boot.log, /var/log/messages |
To collect everything in /var/log while excluding /var/log/apache/*:
| Search path | Filename allowlist |
|---|---|
/var/log | !/var/log/apache/*, /var/log/* |
Examples of Allowlists
Below are typical scenarios where good allowlist technique will save you from duplication headaches.
Example: Excluding the System’s Own Logs
Recall that you’ll often create a set of File Monitor Sources, each of which monitors one file. This is not the right approach in an example like this one, where Discovery Mode is set to Auto. Using Auto mode in a file monitor along with literally any other file monitor can cause unintended, duplicate collection. Use Auto mode carefully!
Here’s the example:
Suppose you added a File Monitor Source on a Linux machine, set your Discovery Mode to Auto, and specified your home directory as the Search path (for example, /home/bogart/).
You do not want to monitor Cribl Stream’s own log files, or any log files generated by Chrome, the web browser you’re using. To exclude them, you add !*cribl*access.log and !*chrome* to your Allowlist. You do want to monitor any other log files that the Source can discover, so you also add *log.
After awhile, the Status tab looks like this:
Example: Fixing Overlapping Monitor Groups
Here’s an example of the kind of overlapping monitor groups you should avoid:
| Search path | Max depth | Filename allowlist |
|---|---|---|
/var | (none) | */log/* |
/var/log/apache | 0 | * |
The above configuration would collect all the files in /var/log/apache/ twice. A better solution would be the following:
| Search path | Max depth | Filename allowlist |
|---|---|---|
/var/log | (none) | !*/apache/* |
/var/log/apache | 0 | * |
Troubleshooting
Common mistakes to avoid when exploring the File Monitor Source include the following.
Don’t Manually Edit Ingested Files
Do not test the File Monitor Source by editing and saving files using a text editor (such as vi or Notepad). Under the hood, these editors operate on a temporary file that they move into place when saved. As a result, the Source sees files get replaced and moved rather than appended to. This confuses the Source’s logic that assumes logs are appended to the existing file.
Instead, to test the Fole Monitor Source, run the command below to append logs to files:
echo "{ \"time\":\"$(date -Is -u)\", \"message\":\"...\" }" >> eg.log
You end up with lines like this in the logs:
{ "time":"2023-09-19T20:08:42+00:00", "message":"..." }
Test File Ingestion with Event Breakers
To make sure that incoming files are split into individual events as expected, test sample file content with Event Breakers. When you configure the Event Breaker Ruleset, configure the timestamp correctly and verify that it works. The Event Breaker will default to “Now” if it can’t find a timestamp in the raw log, and it saves the cursor state at that point.
If the Event Breaker encounters another log later in the file with a timestamp before “Now”, it will ignore it. For details, see Timestamp Settings.