

Sources Overview
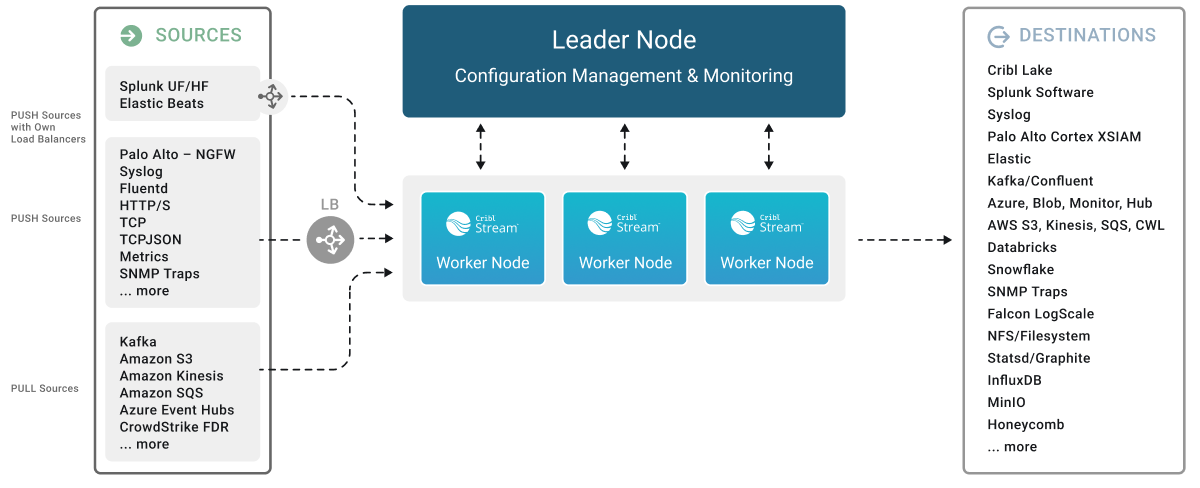
Cribl Stream can receive continuous data input from various Sources, including Splunk, HTTP, Elastic Beats, Kinesis, Kafka, TCP JSON, and many others. Sources can receive data from either IPv4 or IPv6 addresses.
Sources Summary
Cribl Stream supports a variety of HTTP-, TCP-, and UDP-based Sources. All HTTP-based Sources are proxyable.
Data Ingestion Overview
A quick conceptual walkthrough of Cribl Stream data ingestion capabilities.
Collector Sources
Collectors ingest data intermittently in on-demand bursts (“ad hoc collection”), on preset schedules, or by “replaying” data from local or remote stores.
All Collector Sources are proxyable.
These Sources can ingest data only if a Leader is active:
- Amazon S3 (HTTPS only)
- Azure Blob Storage (HTTPS only)
- Cribl Lake
- Database
- File System/NFS
- Google Cloud Storage (HTTPS only)
- Health Check (HTTP/S)
- REST/API Endpoint (HTTP/S)
- Script (executes any shell script you provide and returns the output of that script/command)
- Splunk Search (HTTP/S)
For background and instructions on using Collectors, see:
Check out the example REST Collector configurations in Cribl’s Collector Templates repository. For many popular Collectors, the repo provides configurations (with companion Event Breakers, and event samples in some cases) that you can import into your Cribl Stream instance, saving the time you’d have spent building them yourself.
Push Sources
Supported data Sources that send to Cribl Stream.
In the absence of an active Leader, these Sources can generally continue data ingestion. However, some Sources may experience functional limitations during prolonged Leader unavailability. See the respective Source documentation for details.
- Amazon Data Firehose (HTTPS only)
- Datadog Agent (HTTP/S)
- Elasticsearch API (HTTP/S)
- Grafana (HTTP/S)
- HTTP/S (Bulk API)
- Raw HTTP/S
- Loki (HTTP/S)
- Metrics (TCP or UDP)
- Model Driven Telemetry (gPRC)
- NetFlow & IPFIX (NetFlow v5, v9, and IPFIX over UDP)
- OpenTelemetry (OTel) (gRPC or HTTP/S)
- Prometheus Remote Write (HTTP/S)
- SNMP Trap (UDP)
- Splunk HEC (HTTP/S)
- Splunk TCP
- Syslog (TCP or UDP)
- TCP JSON
- TCP (Raw)
- UDP (Raw)
- Windows Event Forwarder (HTTP/S)
- Zscaler Cloud NSS (HTTP/S)
Data from these Sources is normally sent to a set of Cribl Stream Workers through a load balancer. Some Sources, such as Splunk forwarders, have native load-balancing capabilities, so you should point these directly at Cribl Stream.
Comparison of Generic Push Sources
This table compares generic, protocol-level Push Sources. Refer to this table when you need to ingest raw data or custom formats over basic protocols like HTTP, TCP, or UDP.
| Source | Key Differentiator | Best For… |
|---|---|---|
| HTTP/S (Bulk API) | Protocol-aware: Understands and responds using specific API semantics, including acknowledgments. | Receiving data from systems that require custom or generic HTTP/S event ingestion. |
| Raw HTTP/S | Protocol-agnostic: Accepts any HTTP/S payload without validating its structure. | Capturing any arbitrary or custom HTTP/S traffic where only the raw payload matters. |
| TCP JSON | Content-aware: Specifically designed to parse a stream of distinct JSON objects. | Ingesting a continuous stream of well-formed JSON objects over a reliable TCP connection. |
| TCP (Raw) | Content-agnostic: Treats the incoming data as an unstructured stream of bytes. | Ingesting binary data, custom application protocols, or any non-JSON data over TCP. |
| UDP (Raw) | Stateless with best-effort delivery: Offers lightweight, connectionless data ingestion. | High-volume, loss-tolerant data streams like syslog, NetFlow, or SNMP traps. |
Pull Sources
Supported Sources that Cribl Stream fetches data from.
- Amazon Kinesis Data Streams (HTTPS only) - requires active Leader
- Amazon SQS (HTTPS only)
- Amazon S3 (HTTPS only)
- Amazon Security Lake (HTTPS only)
- Google Cloud Pub/Sub (HTTPS only)
- Azure Event Hubs (TCP)
- Azure Blob Storage (HTTPS only)
- Confluent Cloud (TCP)
- CrowdStrike FDR (HTTPS only)
- Office 365 Services (HTTPS only) - requires active Leader for job management
- Office 365 Activity (HTTPS only) - requires active Leader for job management
- Office 365 Message Trace (HTTPS only) - requires active Leader for job management
- Prometheus Scraper (HTTP/S) - requires active Leader for job management
- Kafka (TCP)
- Amazon MSK (TCP)
- Splunk Search (HTTP/S) - requires active Leader for job management
- Wiz (HTTPS only) - requires active Leader for job management
Pull Sources fetch data from various external systems, with state management varying by Source. Some Sources, like Kafka, manage state independently, while others, such as Office 365 and Kinesis, require an active Leader for job management. This dependency is noted in the Pull Sources list above, indicating which Sources rely on the Leader for state and job management. For details on how each Source interacts with Cribl Stream, refer to the documentation for each Source.
System Sources
Sources supply information generated by Cribl Stream about itself or move data among Workers within your Cribl Stream deployment.
- AppScope (TCP or Unix socket)
- Datagen
- Exec (on-prem only)
- File Monitor (on-prem only)
- Journal files (on-prem only)
- System Metrics (on-prem only)
- System State (on-prem only)
Internal Sources
Similar to System Sources, Internal Sources also supply information generated by Cribl Stream about itself. However, unlike System Sources, they don’t count towards your credit usage or ingest quota.
- Cribl HTTP (HTTP/S)
- Cribl TCP
- Cribl Internal
Configure and Manage Sources
For each Source type, you can create multiple definitions, depending on your requirements.
From Stream Home, under Worker Groups, select a Worker Group to configure. Next, you have two options:
- To configure via QuickConnect:
- Select Routing, then QuickConnect (Stream) or Collect (Edge).
- Select Add Source at left, and select the Source you want from the list, choosing either Add Existing or Add New.
- To configure via Routing:
- Select Data > Sources (Stream) or More > Sources (Edge).
- Select the Source you want.
- Select Add Source to open a New Source modal.
To edit any Source’s definition in a JSON text editor, select Manage as JSON at the bottom of the New Source modal, or on the Configure tab when editing an existing Source. You can directly edit multiple values, and you can use the Import and Export buttons to copy and modify existing Source configurations as .json files.
When JSON configuration contains sensitive information, it is redacted during export.
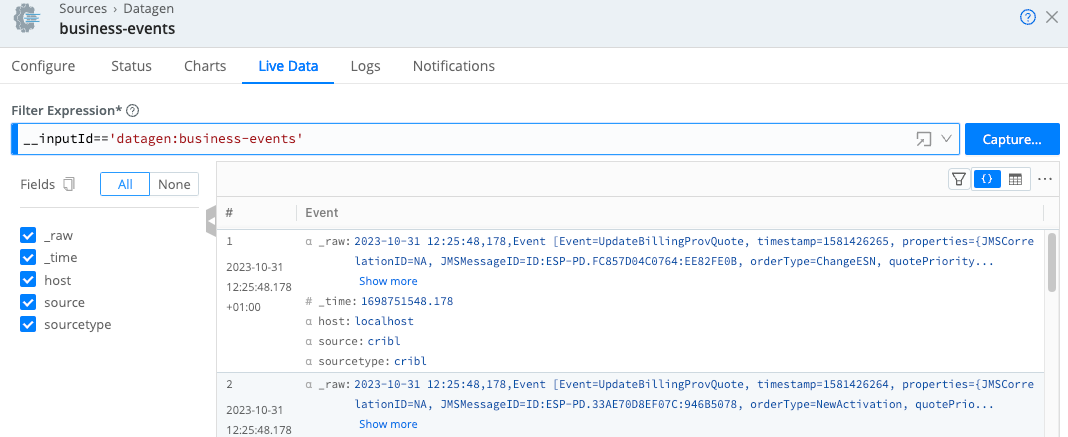
Capture Source Data
To capture data from a single enabled Source, you can bypass the Data Preview pane, and instead capture directly from the list of Sources. Just select the Source type, and then select the Live button beside the Source you want to capture.
To capture live data, you must have Worker Nodes registered to the Worker Group for which you’re viewing events. You can view registered Worker Nodes from the Status tab in the Source.

You can also start an immediate capture from within an enabled Source’s config modal by selecting the Live Data tab.
Monitor Source Status
You can get a quick overview of Source health status by referring to their status icons.
Additionally, each Source’s configuration modal offers two tabs for monitoring: Status and Charts.
Source Status Icons
Source status icons are available on the Data > Destinations page and for each individual Source in the list for a specific Source type.
The icons have the following meanings:
| Icon | Meaning |
|---|---|
| Healthy. Operating correctly. | |
| Warning. Experiencing issues.The Source is not functioning fully. Specific conditions will depend on the Source type. | |
| Critical. Experiencing critical issues.Drill down to the Source’s Status tab to find out the details. | |
| Disabled.The Source is configured, but not enabled. | |
| No health metrics available.This may mean that a Source is enabled, but has not been deployed yet. | |
Inactive. When using GitOps, a Source appears Inactive if its Environment field (configured under Advanced Settings) does not match the currently active environment determined by the deployed Git branch. This ensures integrations only activate in their designated environments, preventing unintended data flow or misconfiguration. |
You can also find status icons on the Cribl Stream front page on Worker Group tiles. or on any tile indicate that one or more Sources or Destinations in this Worker Group are experiencing issues. Hover over the icon to see more details.
Status Tab
The Status tab provides details about the Workers in the group and their status. An icon shows whether the Worker is operating normally.
You can select each Worker’s row to see specific information, for example, to identify issues when the Source displays an error. The specific set of information provided depends on the Source type. The data represents only process 0 for each Worker Node.
The content of the Status tab is loaded live when you open it and only displayed when all the data is ready. With a lot of busy Workers in a group, or Workers located far from the Leader, there may be a delay before you see any information.
The statistics presented are reset when the Worker restarts.
Charts Tab
The Charts tab presents a visualization of the most recent 10 minutes of activity on the Source utlizing internal metrics. This data (in contrast with the status tab) is read almost instantly and does not reset when restarting a Worker.
| Data | Metric |
|---|---|
| Total events in | total.in_events |
| Average throughput (events per second) | Derived from total.in_events |
| Total bytes in | total.in_bytes |
| Average throughput (bytes per second) | Derived from total.in_bytes |
The following charts are available on Cribl.Cloud deployments utilizing the iometrics integration metrics, requiring a metrics level.
| Data | Metric | Level Required |
|---|---|---|
| P95 latency | p95_duration_millis – 95th percentile request latency in milliseconds. | Detailed |
| P99 latency | p99_duration_millis – 99th percentile request latency in milliseconds. | Detailed |
| Failure rate | Percentage of failed requests, calculated as (failed_requests / total_requests) * 100. | Basic |
Preconfigured Sources
To accelerate your setup, Cribl Stream ships with several common Sources configured for typical listening ports, but not switched on. Open, clone (if desired), modify, and enable any of these preconfigured Sources to get started quickly.
On a Cribl.Cloud deployment, do not delete any preconfigured Sources. If you don’t plan to use them, keep them disabled.
- Syslog – UDP Port 9514, TCP Port 9514, TCP + TLS Port 6514
- Splunk TCP – Port 9997
- Splunk HEC – Port 8088
- TCP JSON – Port 10070
- TCP – Port 10060
- HTTP – Port 10080
- Elasticsearch API – Port 9200
- SNMP Trap – Port 9162 (preconfigured only on on-prem setups)
- OpenTelemetry - Port 4317 (preconfigured only on Cribl.Cloud)
System and Internal Sources:
- Cribl Internal > CriblLogs (preconfigured only on on-prem setups)
- Cribl Internal > CriblMetrics
- Appscope
- Cribl HTTP – Port 10200 (preconfigured only on distributed setups)
- Cribl TCP – Port 10300 (preconfigured only on distributed setups)
- System Metrics (preconfigured only on on-prem setups)
- System State (preconfigured only on on-prem setups)
- Journal files (preconfigured only on on-prem setups)
In a preconfigured Source’s configuration, never change the Address field, even though the UI shows an editable field. If you change these fields’ value, the Source will not work as expected.
After you create a Source and deploy the changes, it can take a few minutes for the Source to become available in Cribl.Cloud’s load balancer. However, Cribl Stream will open the port, and will be able to receive data, immediately.
Single Source Support
The following Source types are limited to preconfigured Sources:
- Cribl Internal
- System Metrics
- System State
Cribl.Cloud Ports and TLS Configurations
Cribl.Cloud provides several data Sources and ports already enabled for you,
plus 11 additional TCP ports (20000-20010) that you can use to add and configure more Sources.
The Cribl.Cloud portal’s Data Sources page displays the pre‑enabled Sources, their endpoints, the reserved and available ports, and protocol details. For each existing Source listed here, Cribl recommends using the preconfigured endpoint and port to send data into Cribl Stream.
To access the Data Sources page, on the top bar, select Products, and then select Cribl > Workspace > Data Sources.
Cribl HTTP and Cribl TCP Sources/Destinations
Use the Cribl HTTP Destination and Source, and/or the Cribl TCP Destination and Source, to relay data between Worker Nodes connected to either the same Leader or different Leaders. This traffic does not use Cribl Credits or count against your ingestion quota on the receiving Organization. (For related details, see Transfer Data Between Workspaces or Environments.)
Backpressure Behavior and Persistent Queues
By default, a Cribl Stream Source will respond to a backpressure situation by blocking incoming data. Backpresssure triggers exist when an in-memory buffer is full and/or when downstream Destinations/receivers are unavailable. The Source will refuse to accept new data until it can flush its buffer.
This will propagate block signals back to the sender, if it supports backpressure. Note that UDP senders (including SNMP Traps and some syslog senders) do not provide this support. In this situation, Cribl Stream will simply drop new events until the Source can process them.
Persistent Queues
Push Sources’ config modals provide a Persistent Queue Settings option to minimize loss of inbound streaming data. Here, the Source will write data to disk until its in-memory buffer recovers. Then, it will drain the disk-queued data in FIFO (first in, first out) order.
When you enable Source PQ, you can choose between two trigger conditions: Smart Mode will engage PQ upon backpressure from Destinations, whereas Always On Mode will use PQ as a buffer for all events.
For details about the PQ option and these modes, see Persistent Queues.
Persistent queues, when engaged, slow down data throughput somewhat. It is redundant to enable PQ on a Source whose upstream sender is configured to safeguard events in its own disk buffer.
Other Backpressure Options
The S3 Source provides a configurable Advanced Settings > Socket timeout option, to prevent data loss (partial downloading of logs) during backpressure delays.
Diagnosing Backpressure Errors
When backpressure affects HTTP Sources (Splunk HEC, HTTP/S, Raw HTTP/S, and Amazon Data Firehose), Cribl Stream internal logs will show a 503 error code.